

Analytics for CMS
The Analytics dashboard for Content Management System (CMS) gives organization owners and admins a centralized view of how the CMS is used across their organization. It covers resource consumption, API activity, bandwidth, assets, entries, and device usage across all stacks.
Estimated reading time: 5 minutes
Skill level: Intermediate
Prerequisites
- Contentstack account
- Organization Owner or Admin permissions
What You Will Learn
-
How to access the CMS Analytics dashboard.
-
What each dashboard section shows and what metrics it includes.
-
How to apply filters and save custom views.
Access the CMS Analytics Dashboard
To access the Analytics dashboard, log in to your Contentstack account and perform the following steps:
-
Navigate to Analytics through the "App Switcher".
-
By default, the CMS analytics dashboard appears, which shows detailed metrics specific to your CMS usage.
Note: Dashboard data updates every 24 hours. Data shown does not reflect real-time activity.
CMS Analytics Dashboard Sections
The Analytics dashboard is divided into several sections, each providing valuable insights into different aspects of your CMS usage. These sections help you monitor and optimize your performance, resource utilization, and overall efficiency.
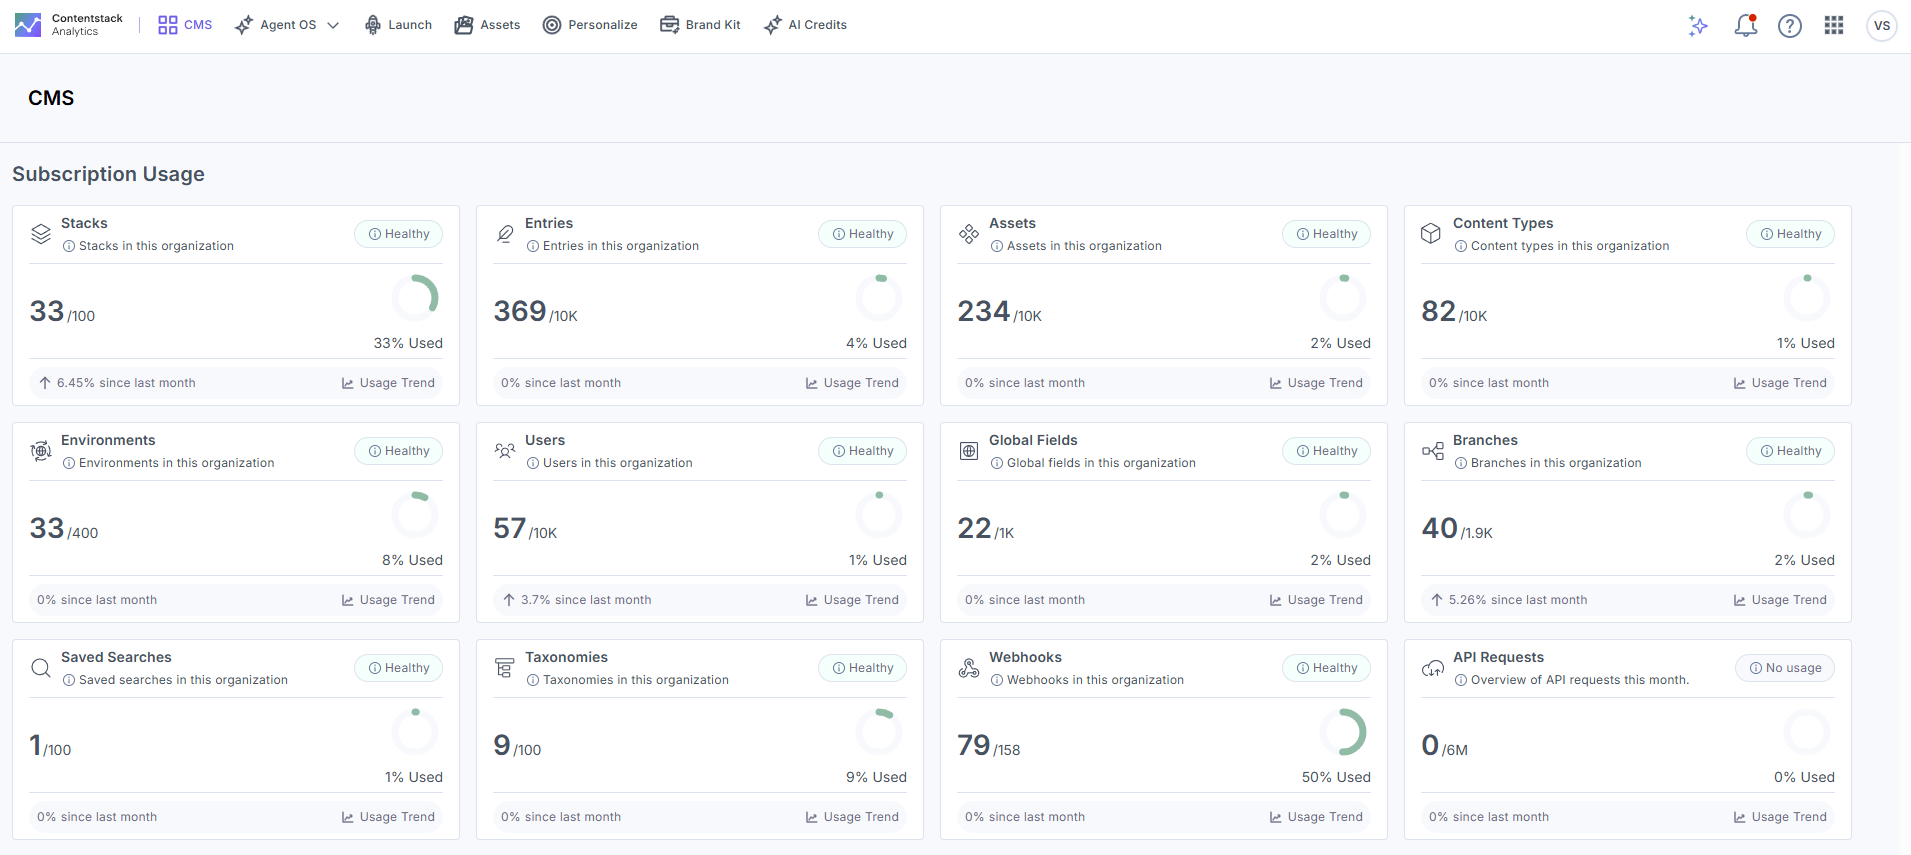
Subscription Usage
This section shows your organization's current CMS resource consumption, including bandwidth, API requests, and the number of stacks, entries, assets, content types, and other resource metrics. It compares current usage against your subscription's allocated limits.
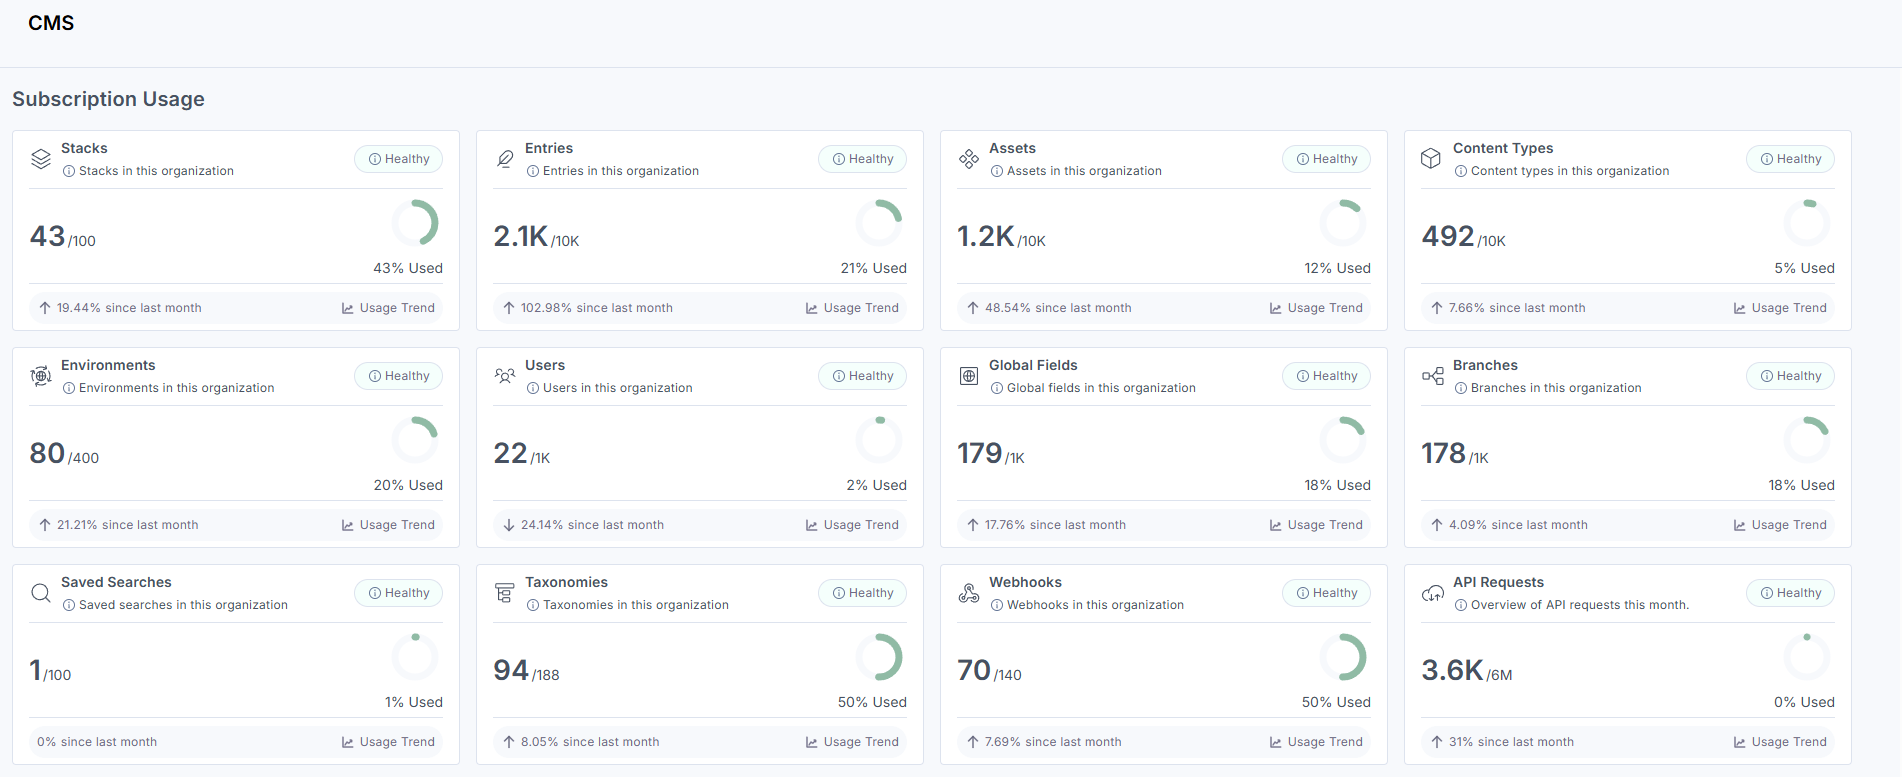
Note: The data displayed reflects usage from the last 30 days. For example, if viewed on February 20, the metrics cover the period from January 21 to February 20.
Usage by Stacks
This section offers detailed metrics for each stack, allowing you to monitor the performance and resource utilization of individual stacks within your CMS. This information helps in managing and optimizing your content infrastructure effectively.
Metrics available for each stack:
-
Stack Name: Name of all stacks within your organization.
-
API Key: API keys of the listed stacks.
-
Owner: Email addresses of the owners of the listed stacks.
-
Content Types: Number of content types within the stacks.
-
Global Fields: Number of global fields within the stacks.
-
Entries: Number of entries created within the stacks.
-
Assets: Number of assets present within the stacks.
-
Environments: Number of environments created within the stacks.
-
Locales: Number of languages created within the stacks.
-
Extensions: Number of extensions created within the stacks.
-
Webhooks: Number of webhooks created within the stacks.
-
Custom Roles: Number of custom roles within the stacks.
-
Branches: Number of branches within the stacks.
-
Branch Aliases: Number of branch aliases within the stacks.
Note: Global Fields, Extensions, Branches, and Branch Aliases are plan-based features. To enable these features for your organization, contact the support team.
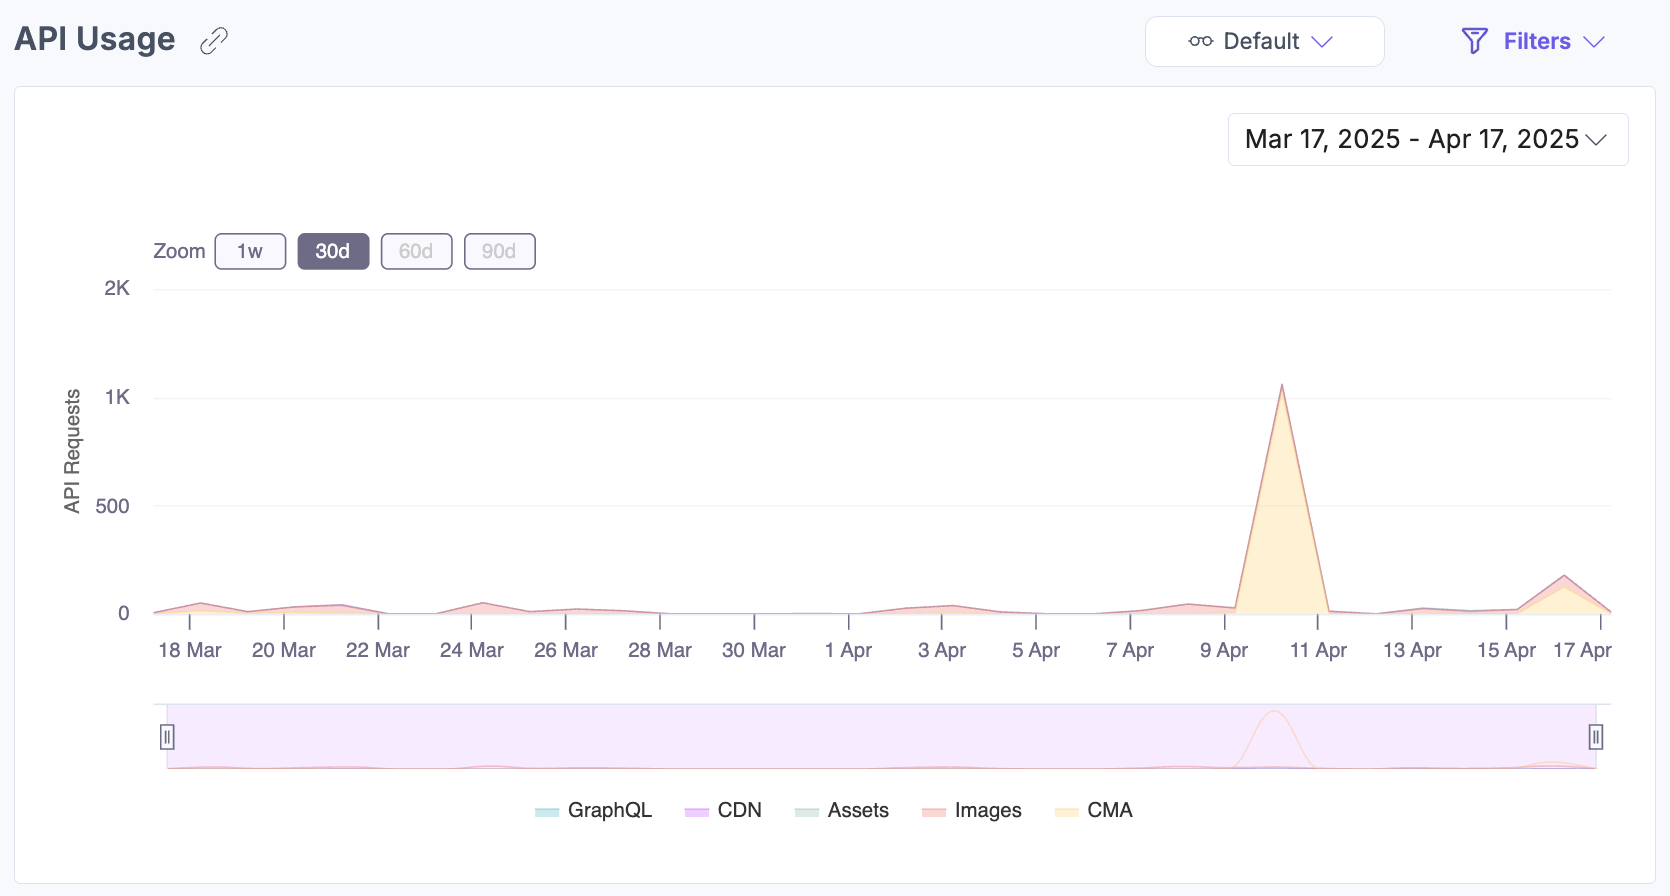
API Usage
The API Usage section shows a visualization of API call volume over a selected time frame. Hover over the chart to see API utilization at a specific timestamp.
Bandwidth Usage
The Bandwidth Usage section shows bandwidth consumption over time, helping you track usage against your subscription limits. Hover over the chart to see bandwidth usage at a specific timestamp.

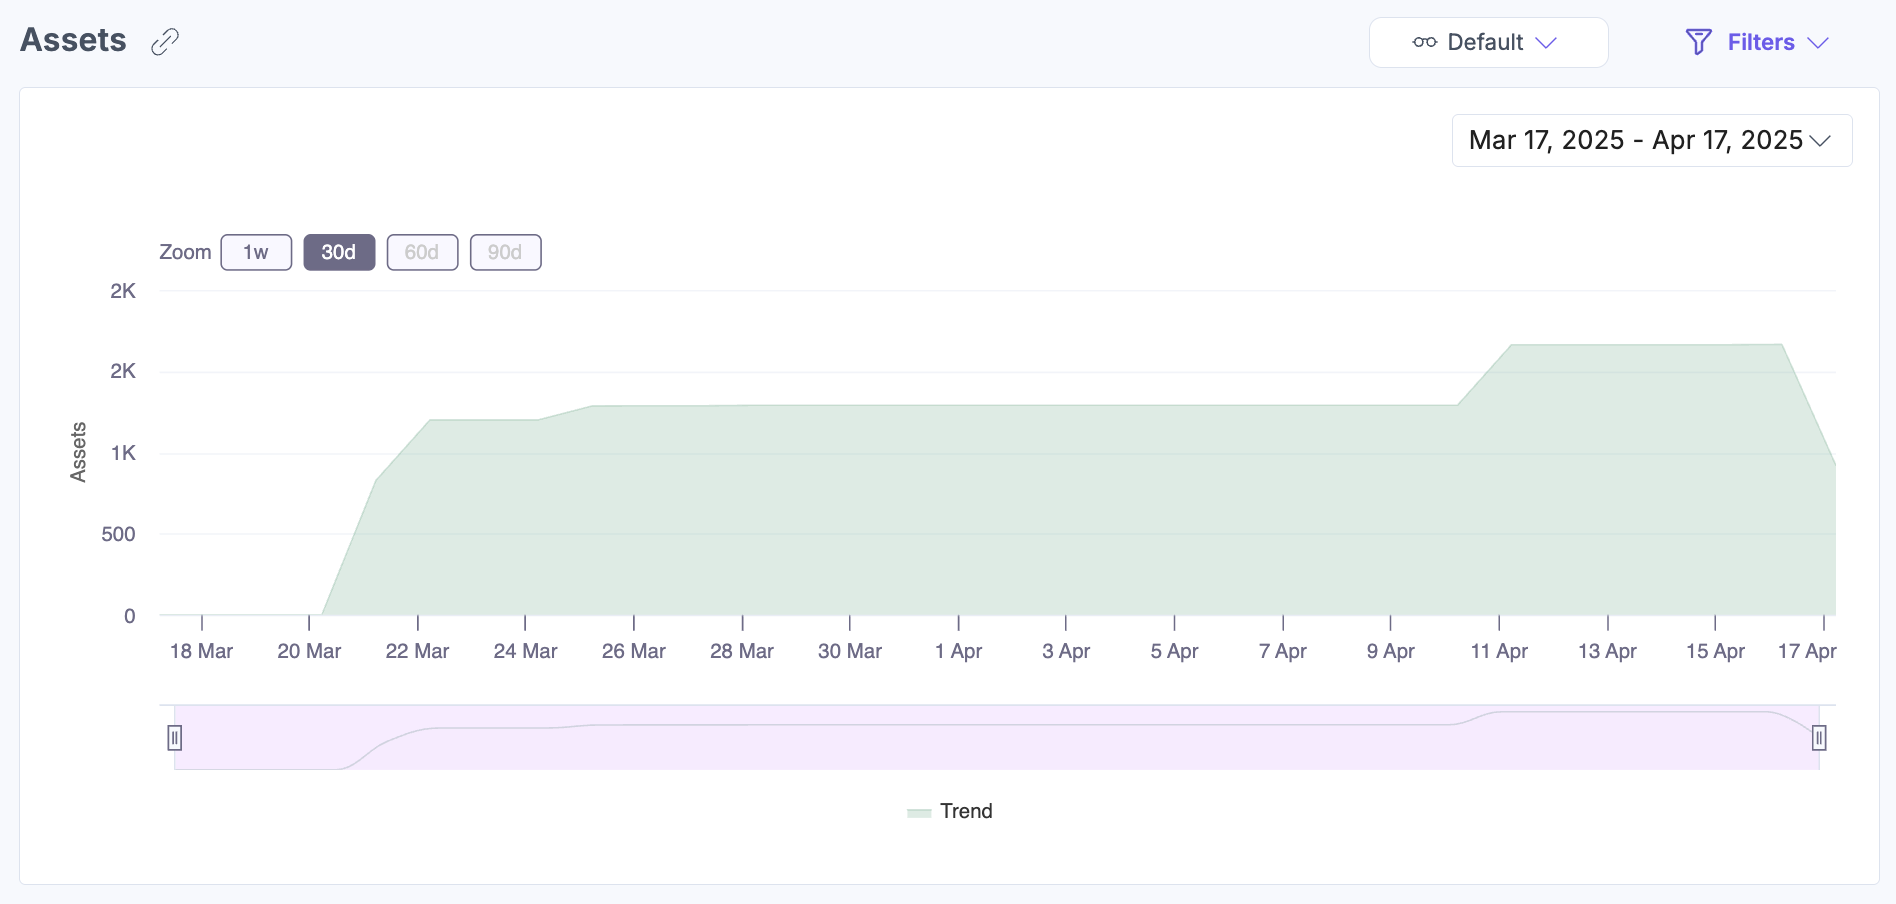
Assets
The Assets section shows the total number of assets available within your organization and tracks asset count trends over a selected time frame.
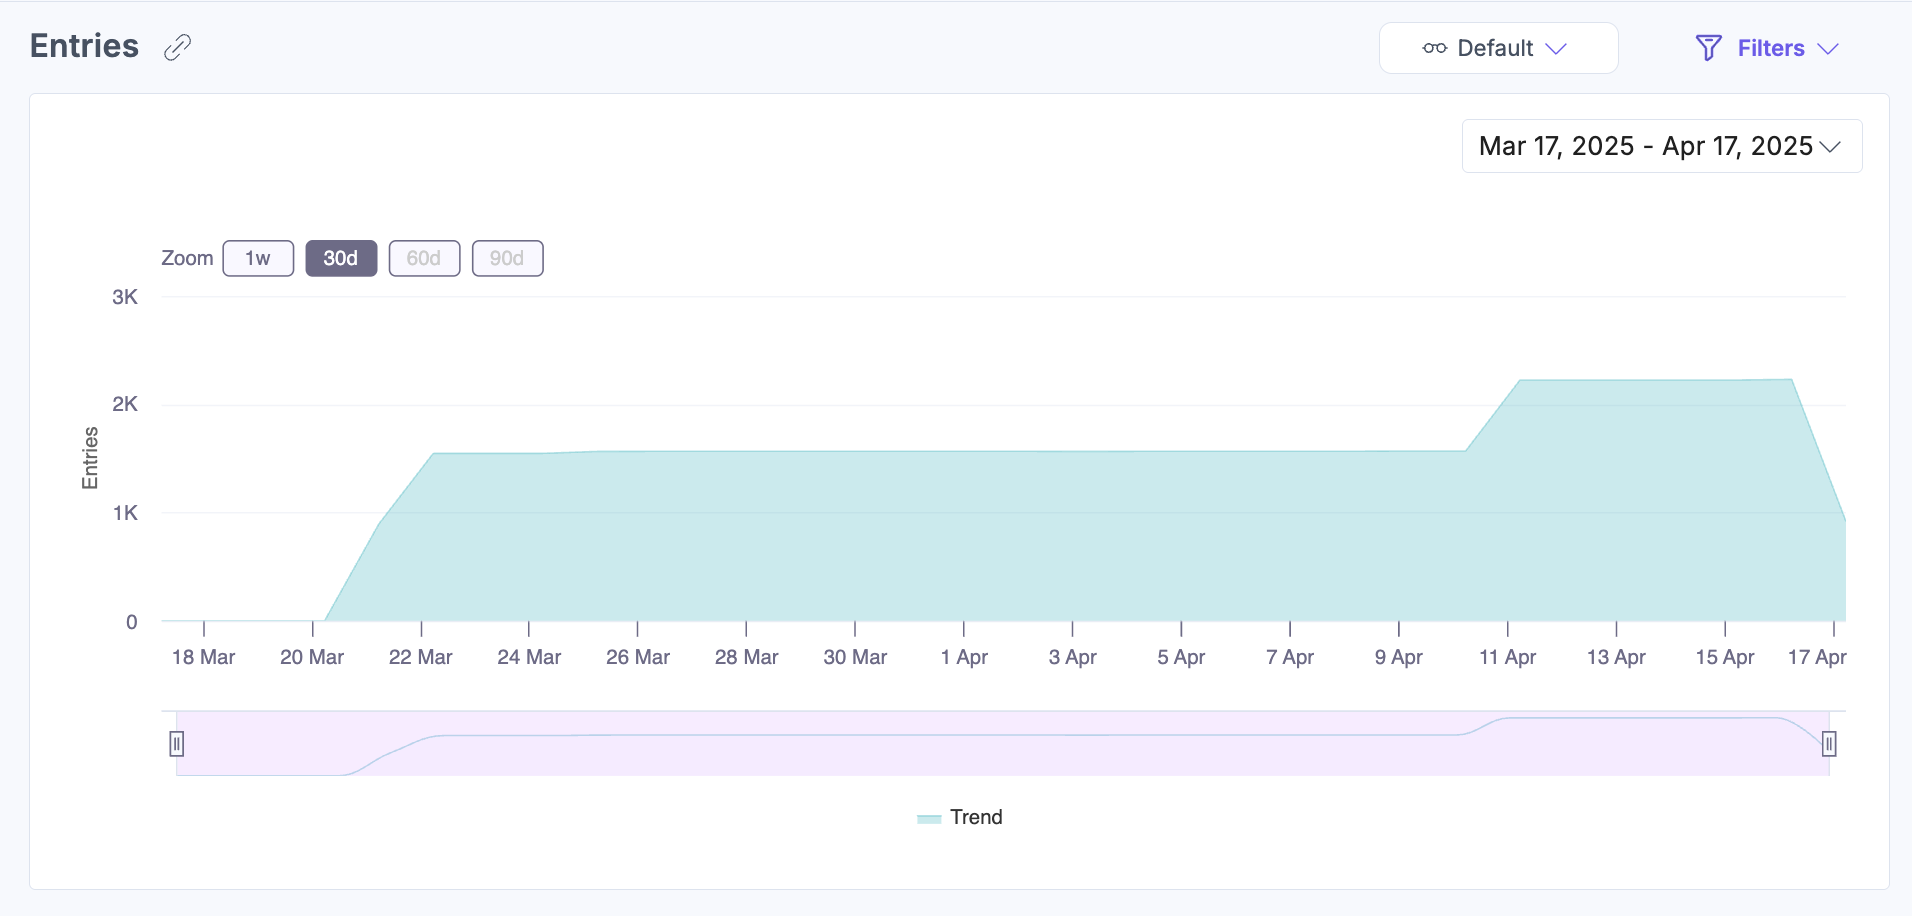
Entries
The Entries section shows the total number of entries available within your organization.
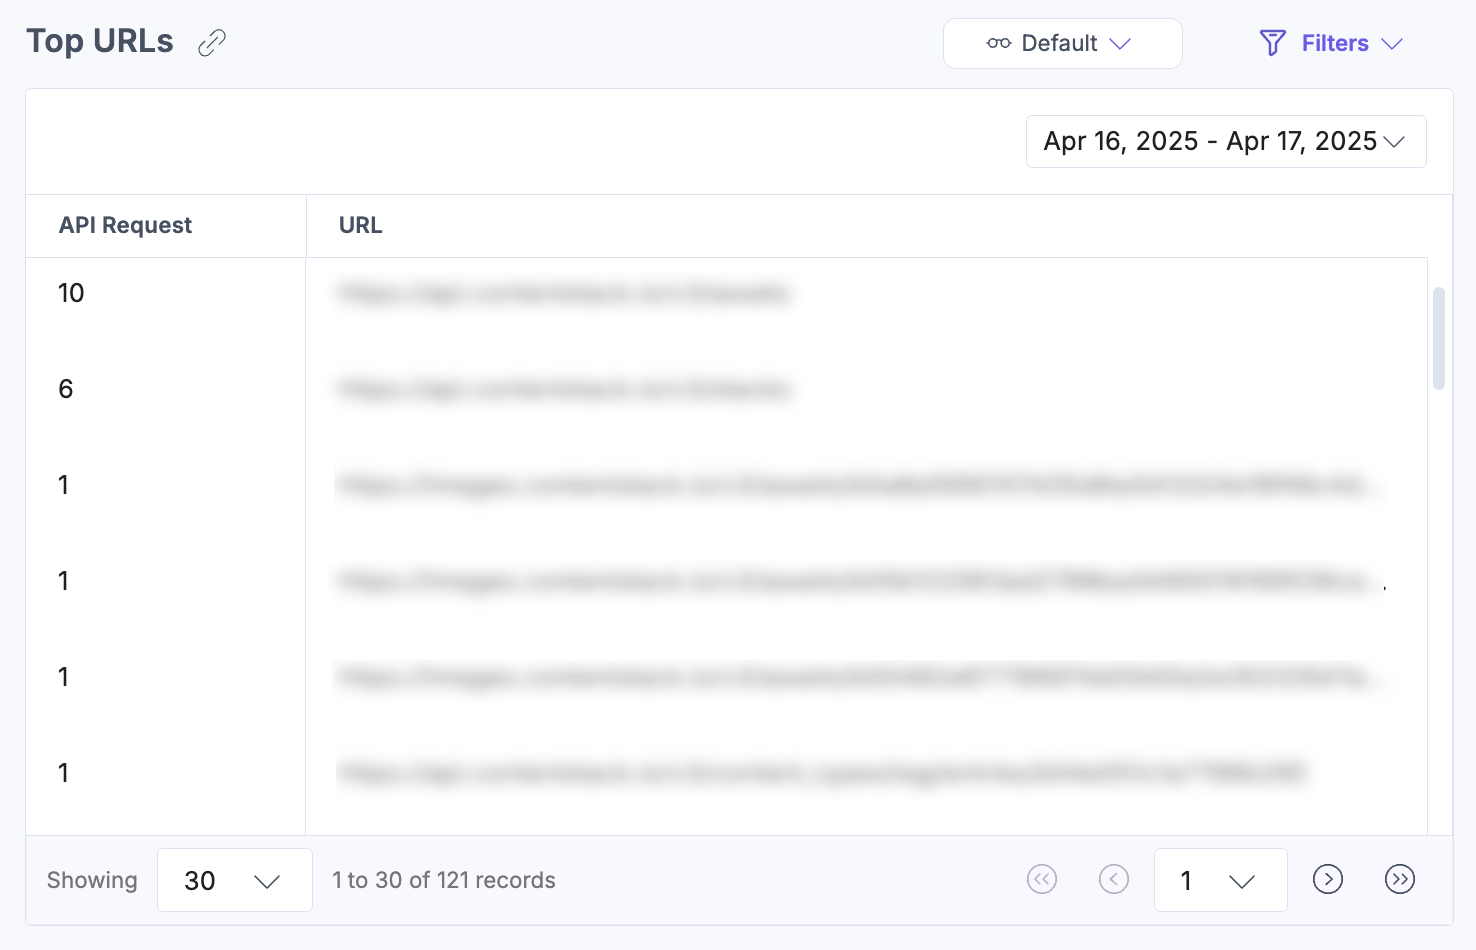
Top URLs
The Top URLs section shows the most frequently accessed API endpoints within your CMS, helping you understand usage patterns and identify opportunities to optimize performance.
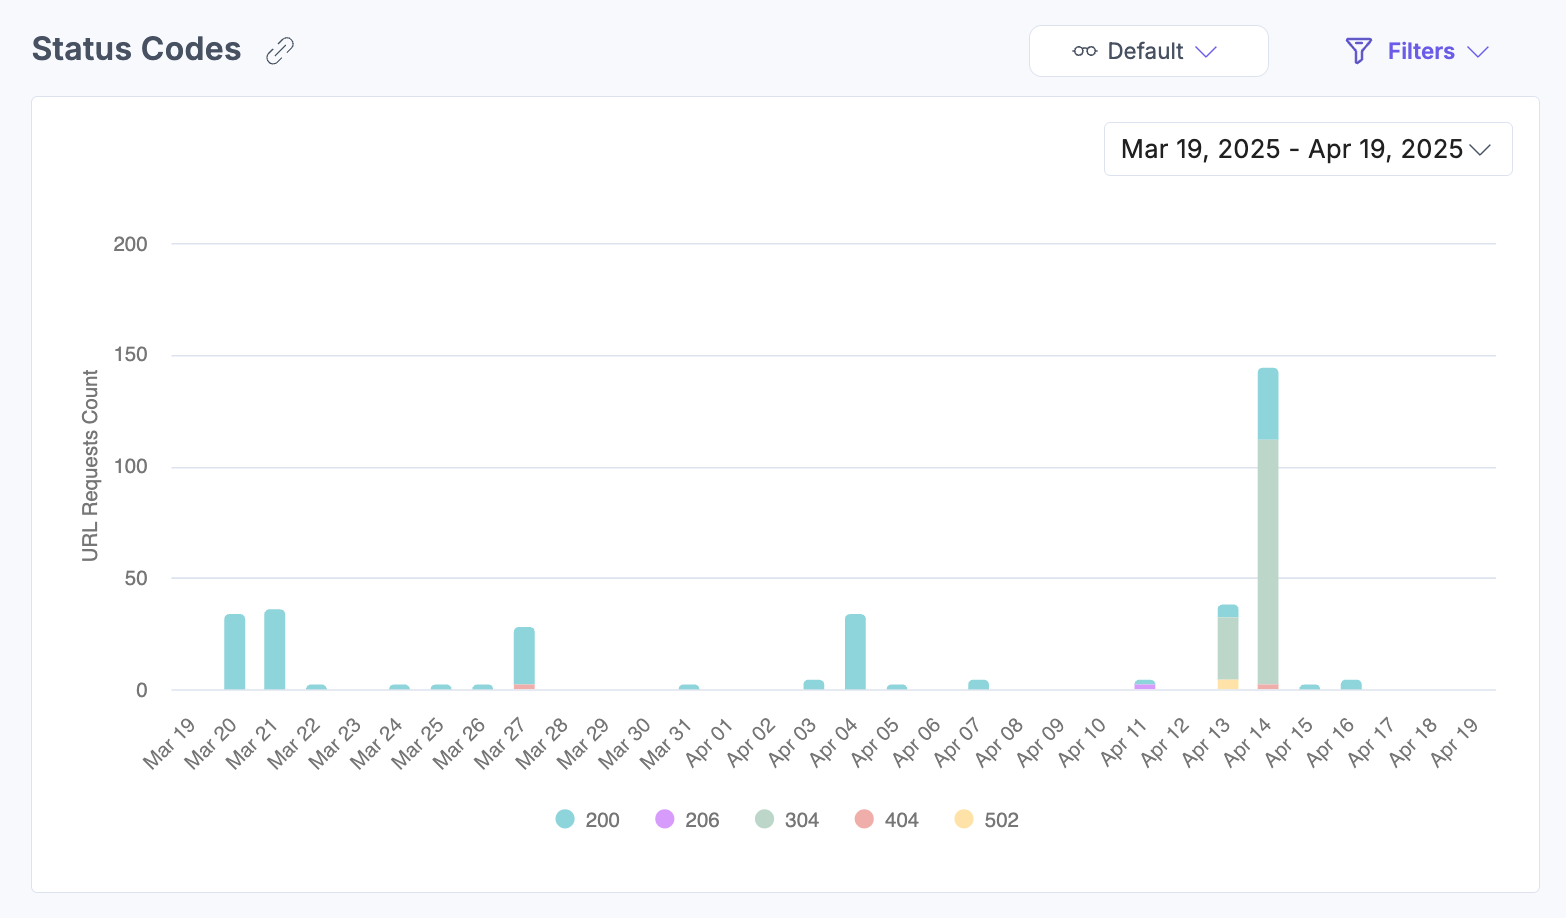
Status Codes
The Status Codes section shows the outcomes of API calls, including successful requests, errors, and unsupported requests, so you can identify and address issues quickly.
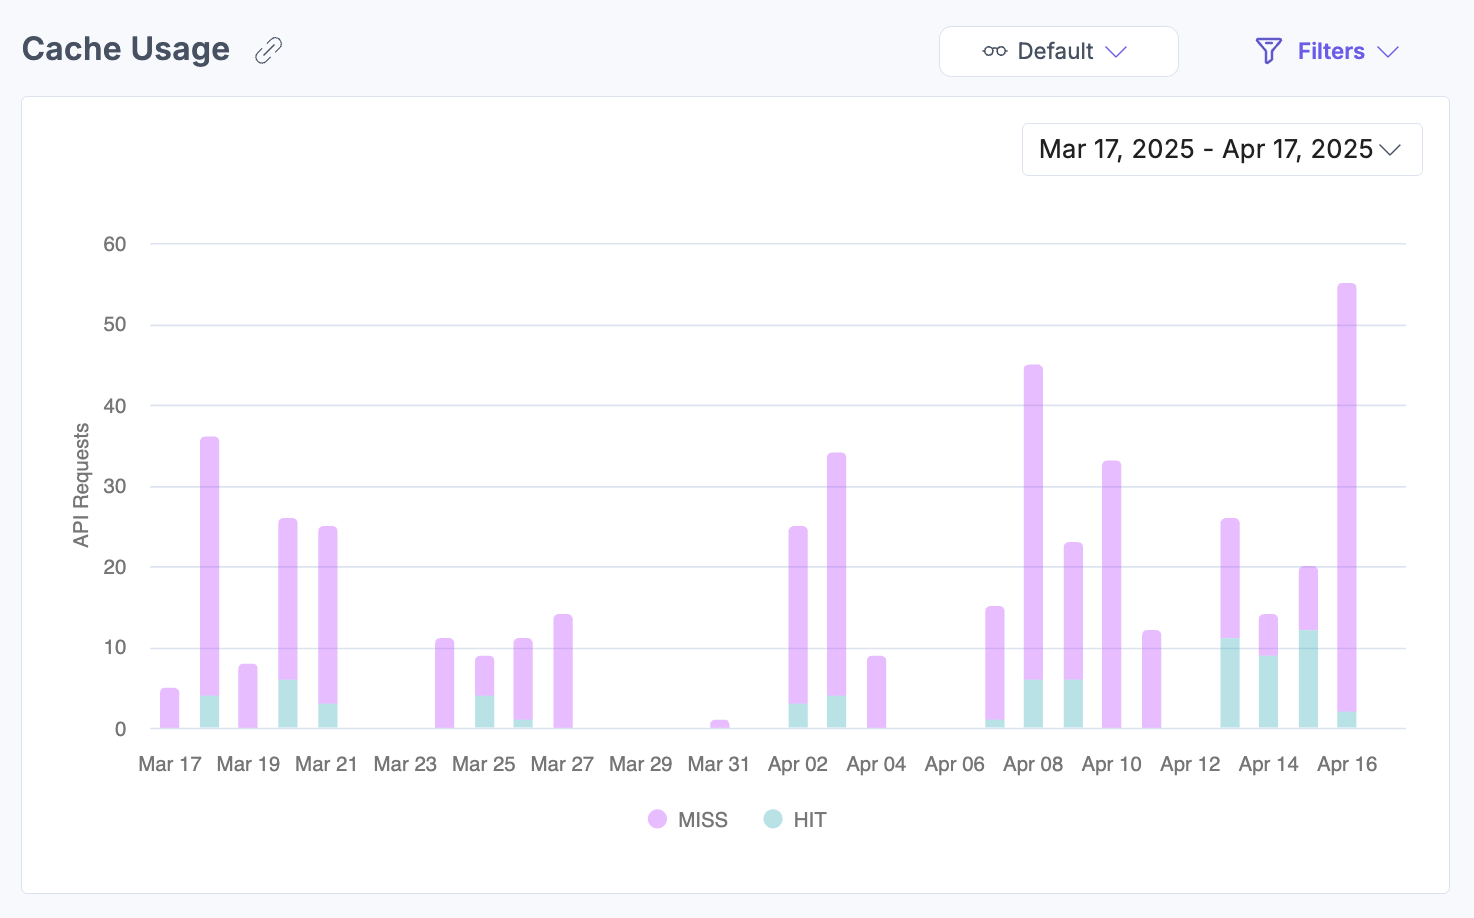
Cache Usage
The Cache Usage section shows API call hit and miss ratios, helping you assess and optimize your cache configuration. You can filter the chart to display only HITs or MISSes.
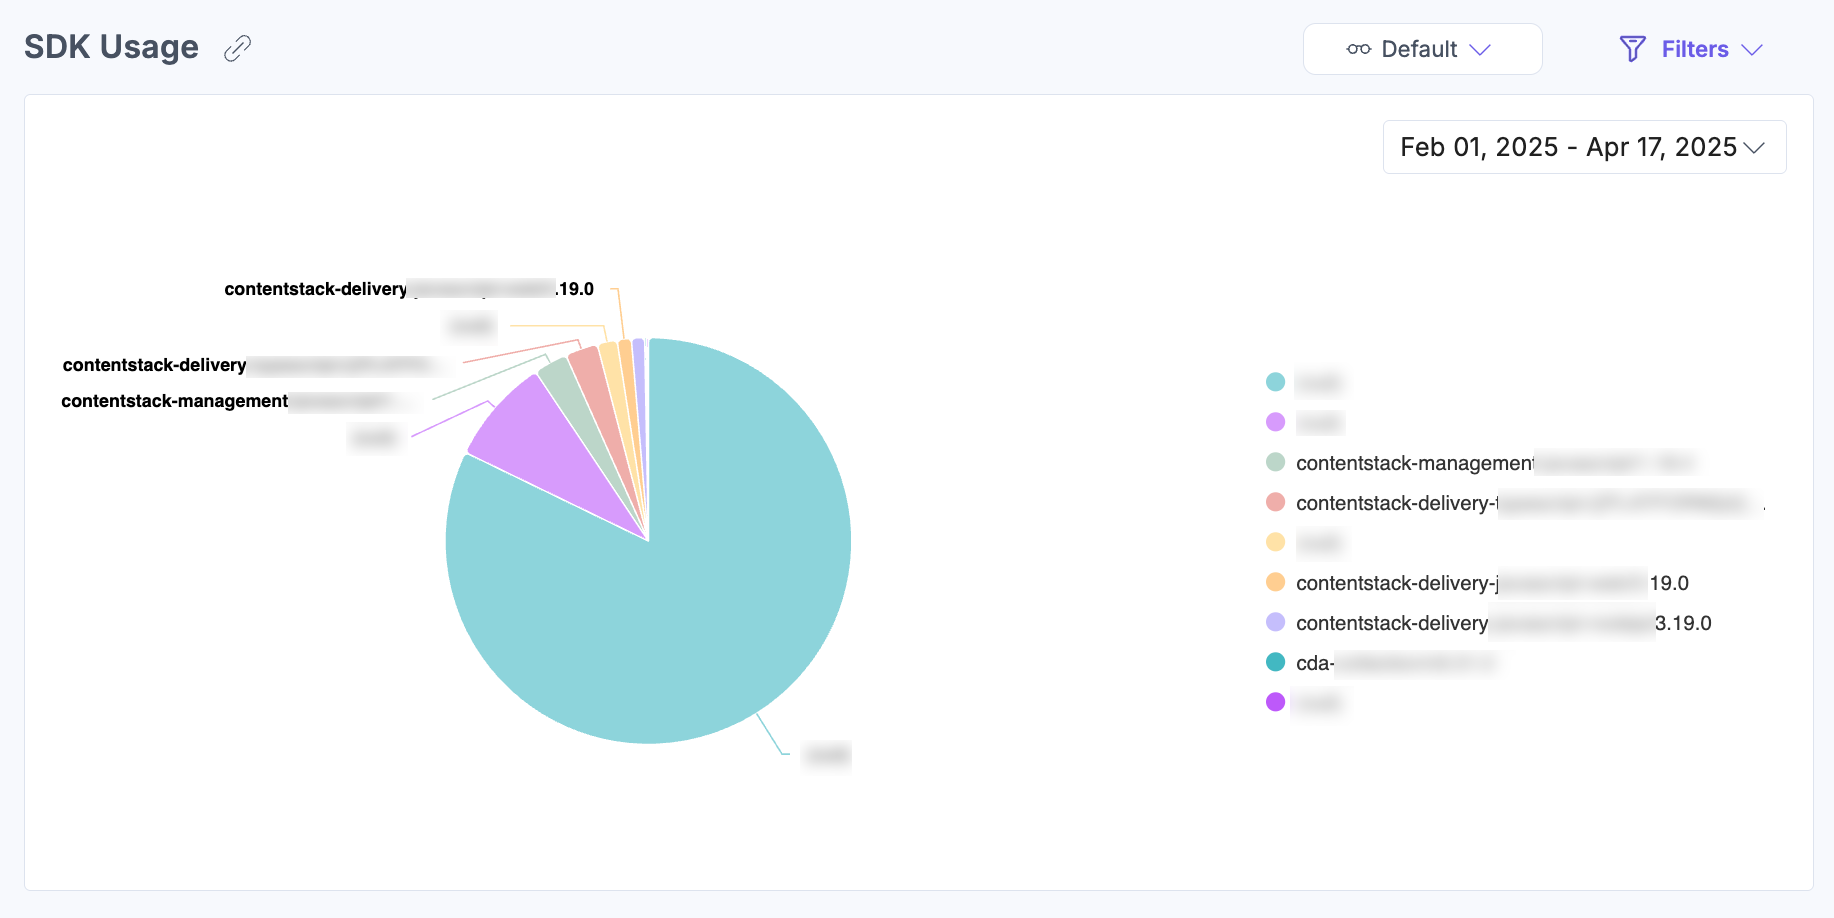
SDK Usage
The SDK Usage section shows a pie chart of SDK consumption across your customers, helping you track the usage of individual SDKs.
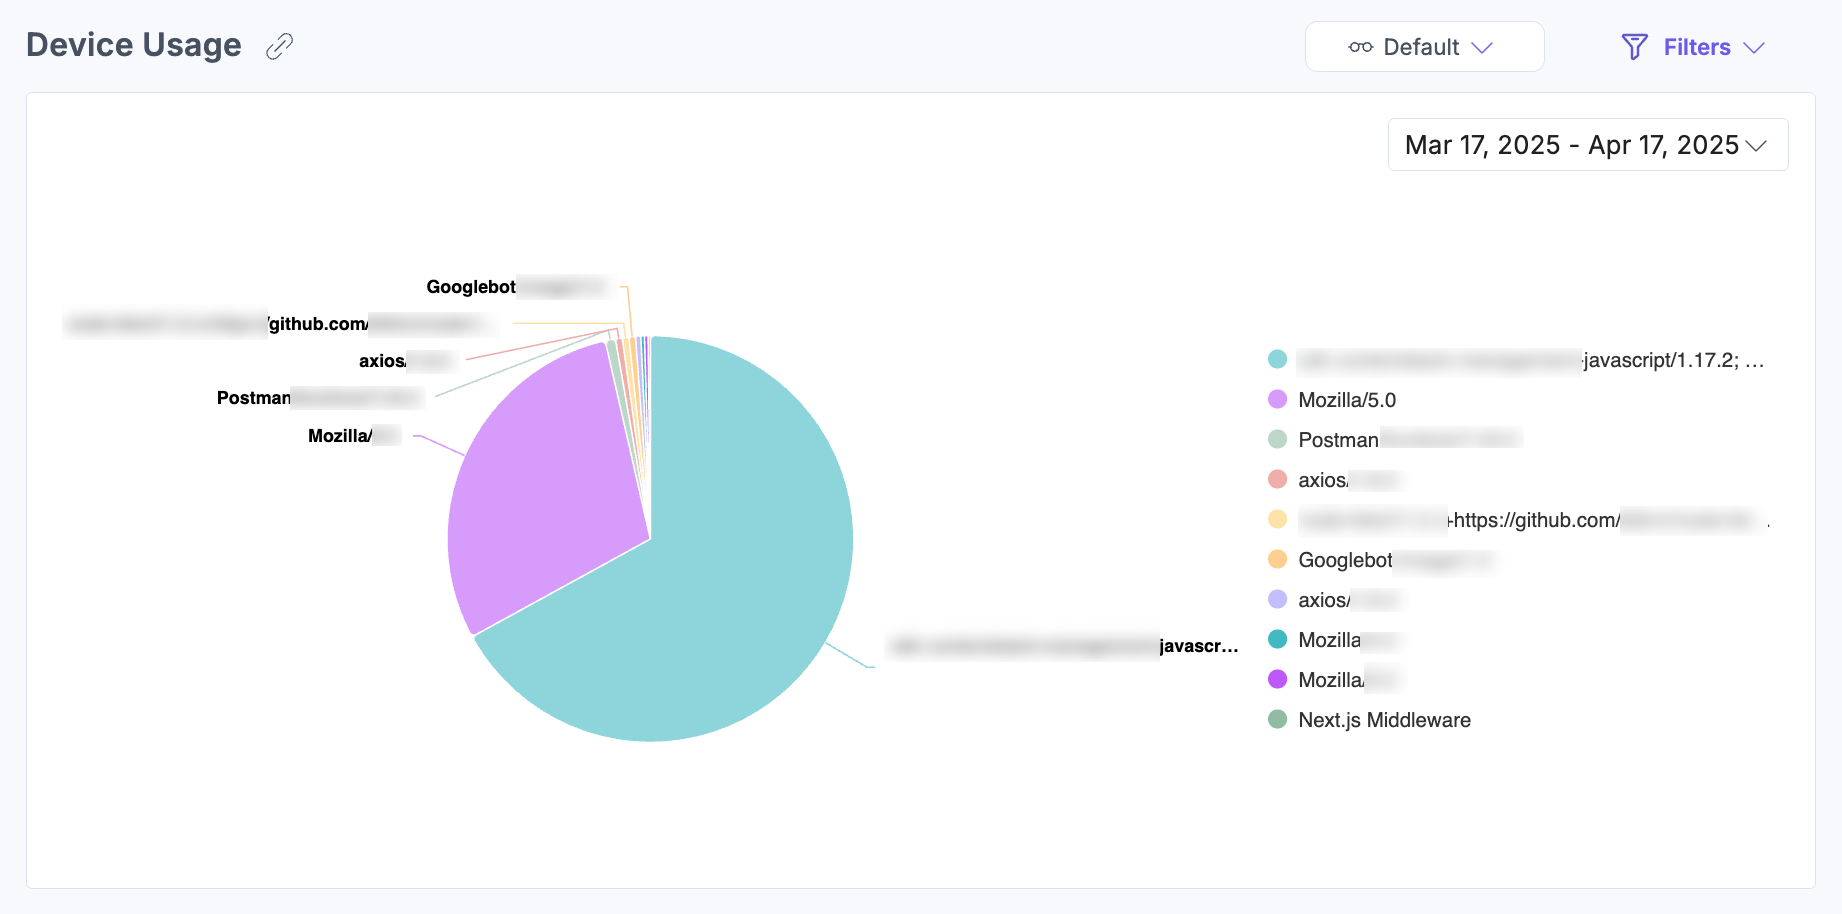
Device Usage
The Device Usage section shows a pie chart of the device types used to access your CMS. Use this data to understand how users access your content and optimize accordingly.
The analytics dashboard for CMS offers crucial insights into your resource usage.
Apply Filters and Manage Views
To apply filters, click Filters and then the Apply Filter(s) button after selecting your desired options.
You can refine dashboard data using the following filters:
-
Stacks: Select specific stacks or choose All Stacks for a consolidated view.
-
Services: Filter API requests by specific services or view all services together.
-
Status Code: Filter the chart to show only specific status codes.
-
Cache: Filter the chart to show only HITs or MISSes.
-
Group By: Organize data by daily, weekly, or monthly intervals.
-
Date Range: Choose from predefined time filters: 1 week, 30 days (default), 60 days, or 90 days. Some sections include a date selector below the graph to refine data for a custom period within the last 90 days.
-
Custom Date: Use the date dropdown to set a specific or custom range.
Note: The custom date range must not exceed 90 days.
To save a filter combination as a view, click the horizontal ellipsis (...) beside Reset and select Save As New View. Saved views are accessible from the dropdown without needing to reapply filters manually.
Related Resources
More articles in "Work with Analytics"
