

Analytics for Personalize
The Personalize Analytics dashboard gives organization Owners and Admins a centralized view of how Contentstack Personalize is being used across the organization. Use it to track subscription consumption, monitor API activity, and analyze usage patterns over time.
Estimated reading time: 3 minutes
Skill level: Intermediate
Prerequisites
- Contentstack account
- Organization Owner or Admin permissions
What You Will Learn
- How to open the Personalize Analytics dashboard.
- What each dashboard section measures.
- How to filter data and save filter combinations as views.
Access the Personalize Analytics Dashboard
To access the Analytics dashboard, log in to your Contentstack account and perform the following steps:
-
Navigate to Analytics through the "App Switcher".
-
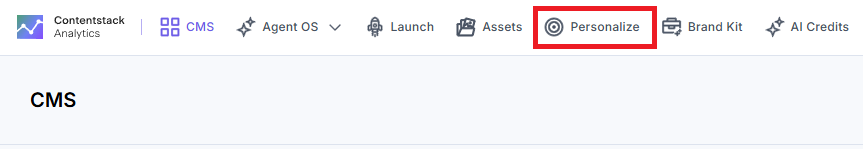
By default, the CMS dashboard appears. Click Personalize to switch to the Personalize dashboard.
Note: The data in the Personalize dashboard is updated every 24 hours.
Personalize Analytics Dashboard Sections
The dashboard is divided into several sections, each offering insights into different aspects of your Personalize usage to help optimize performance and resource utilization.
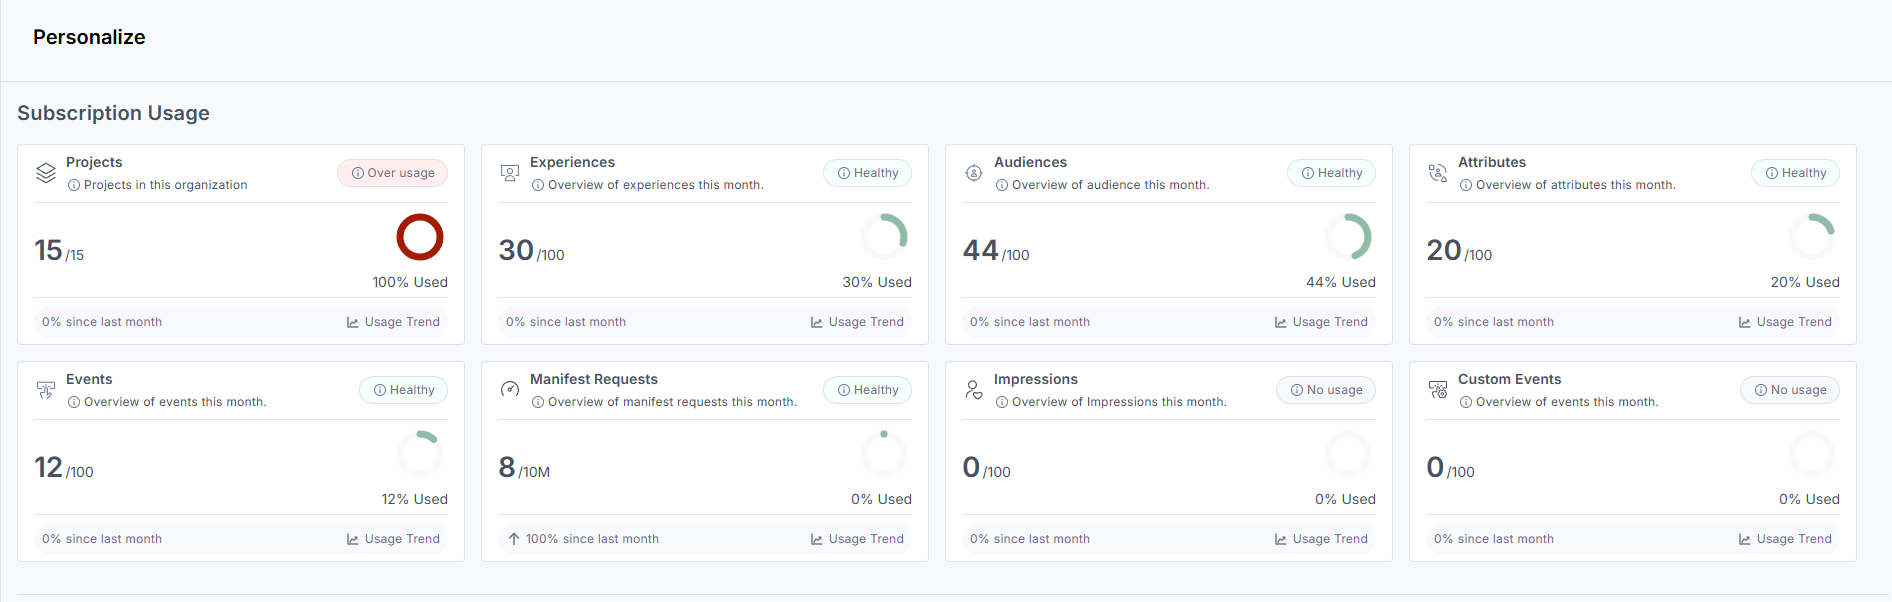
Subscription Usage
This section shows your Personalize resource consumption measured against your allocated limits. It tracks the following parameters:
-
Projects: Number of projects created.
-
Experiences: Total configured experiences.
-
Audiences: Number of defined personalization audiences.
-
Attributes: User attributes in use.
-
Manifest Requests: Requests for retrieving personalized content.
-
Events: Total events captured for personalization.
-
Impressions: Count of personalized content displays.
-
Custom Events: Number of tracked custom events.
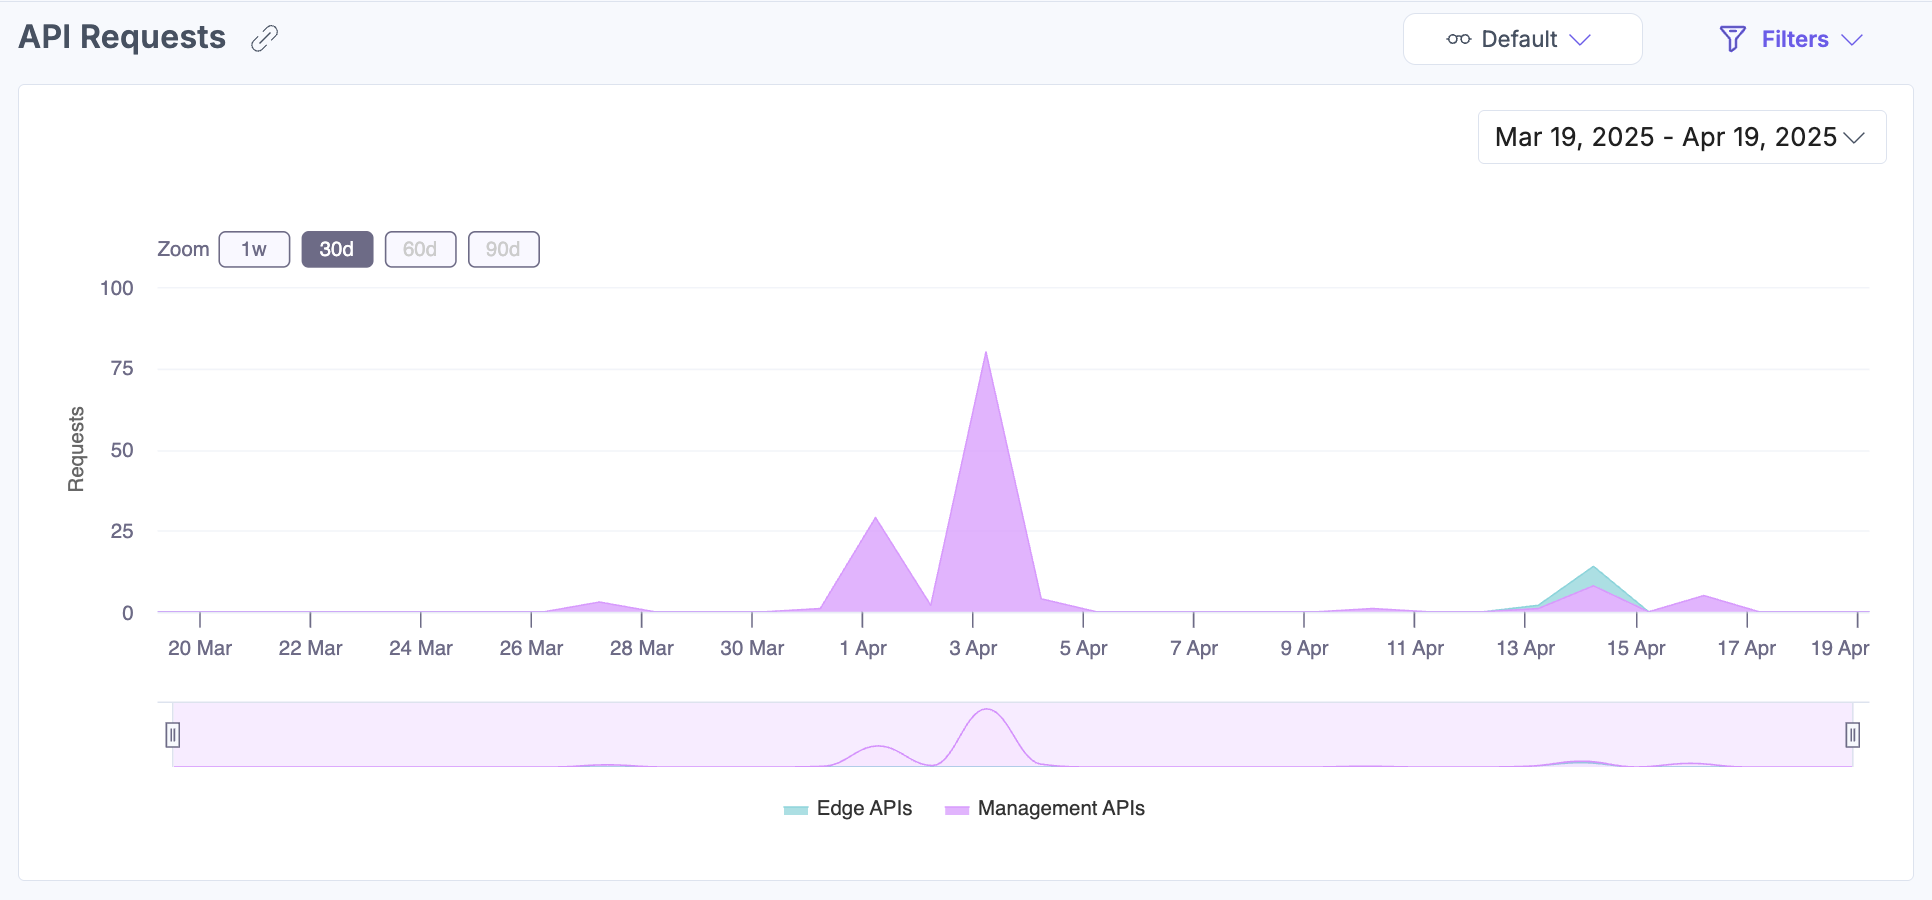
API Requests
This section visualizes Personalize Edge and Management API usage over a selected time frame. Hover over the chart to view utilization at specific timestamps.
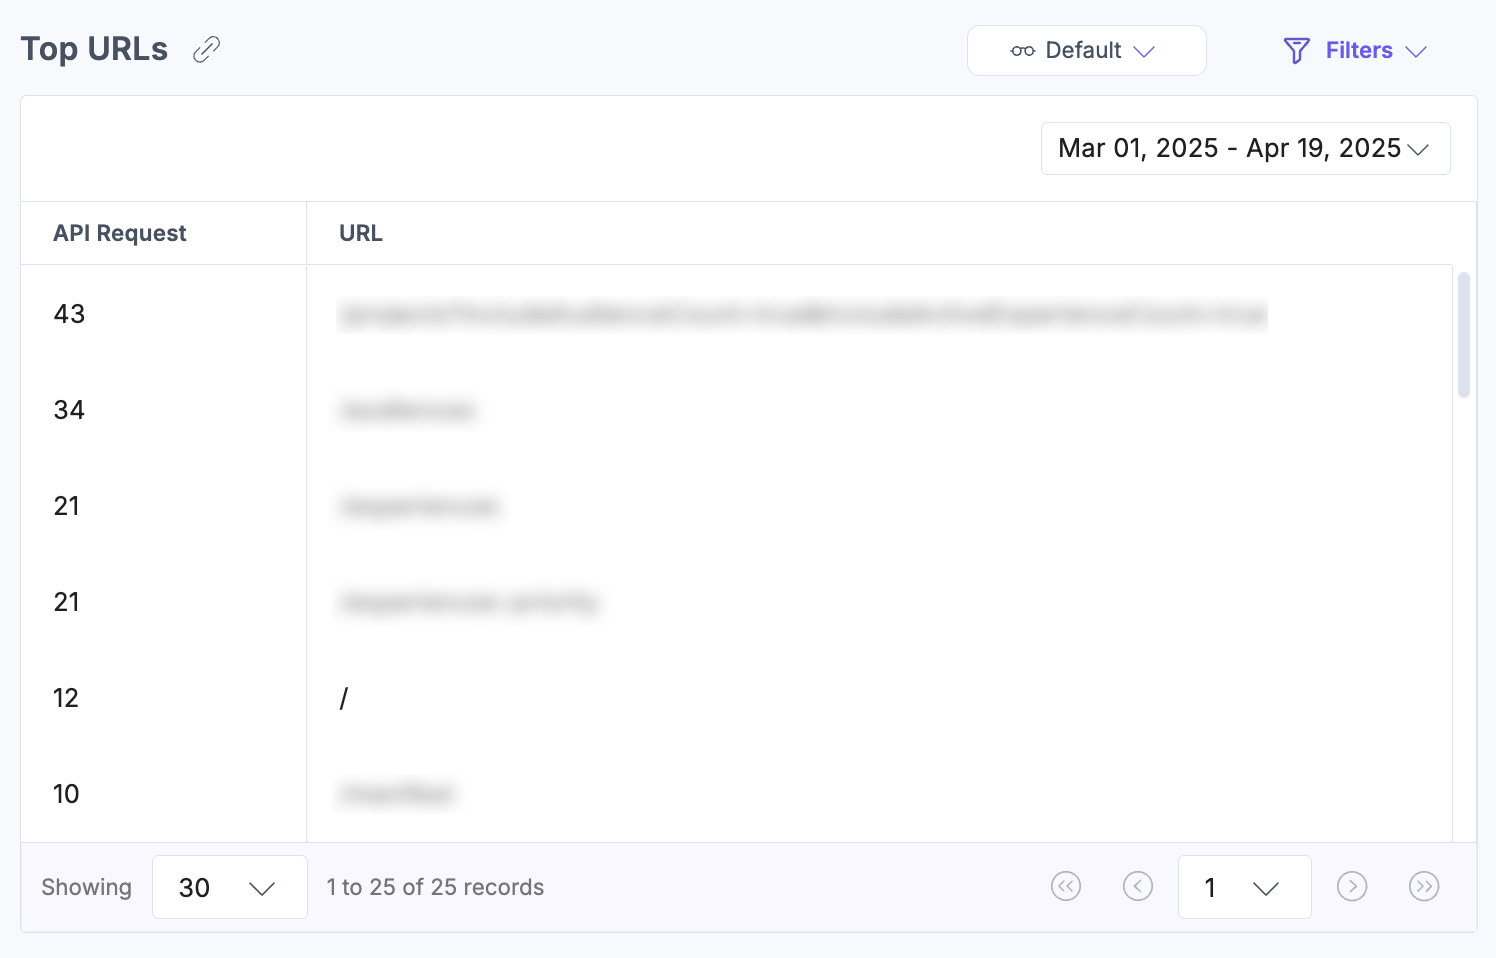
Top URLs
This section displays the most frequently accessed Personalize API endpoints. Use it to analyze usage trends and optimize performance.
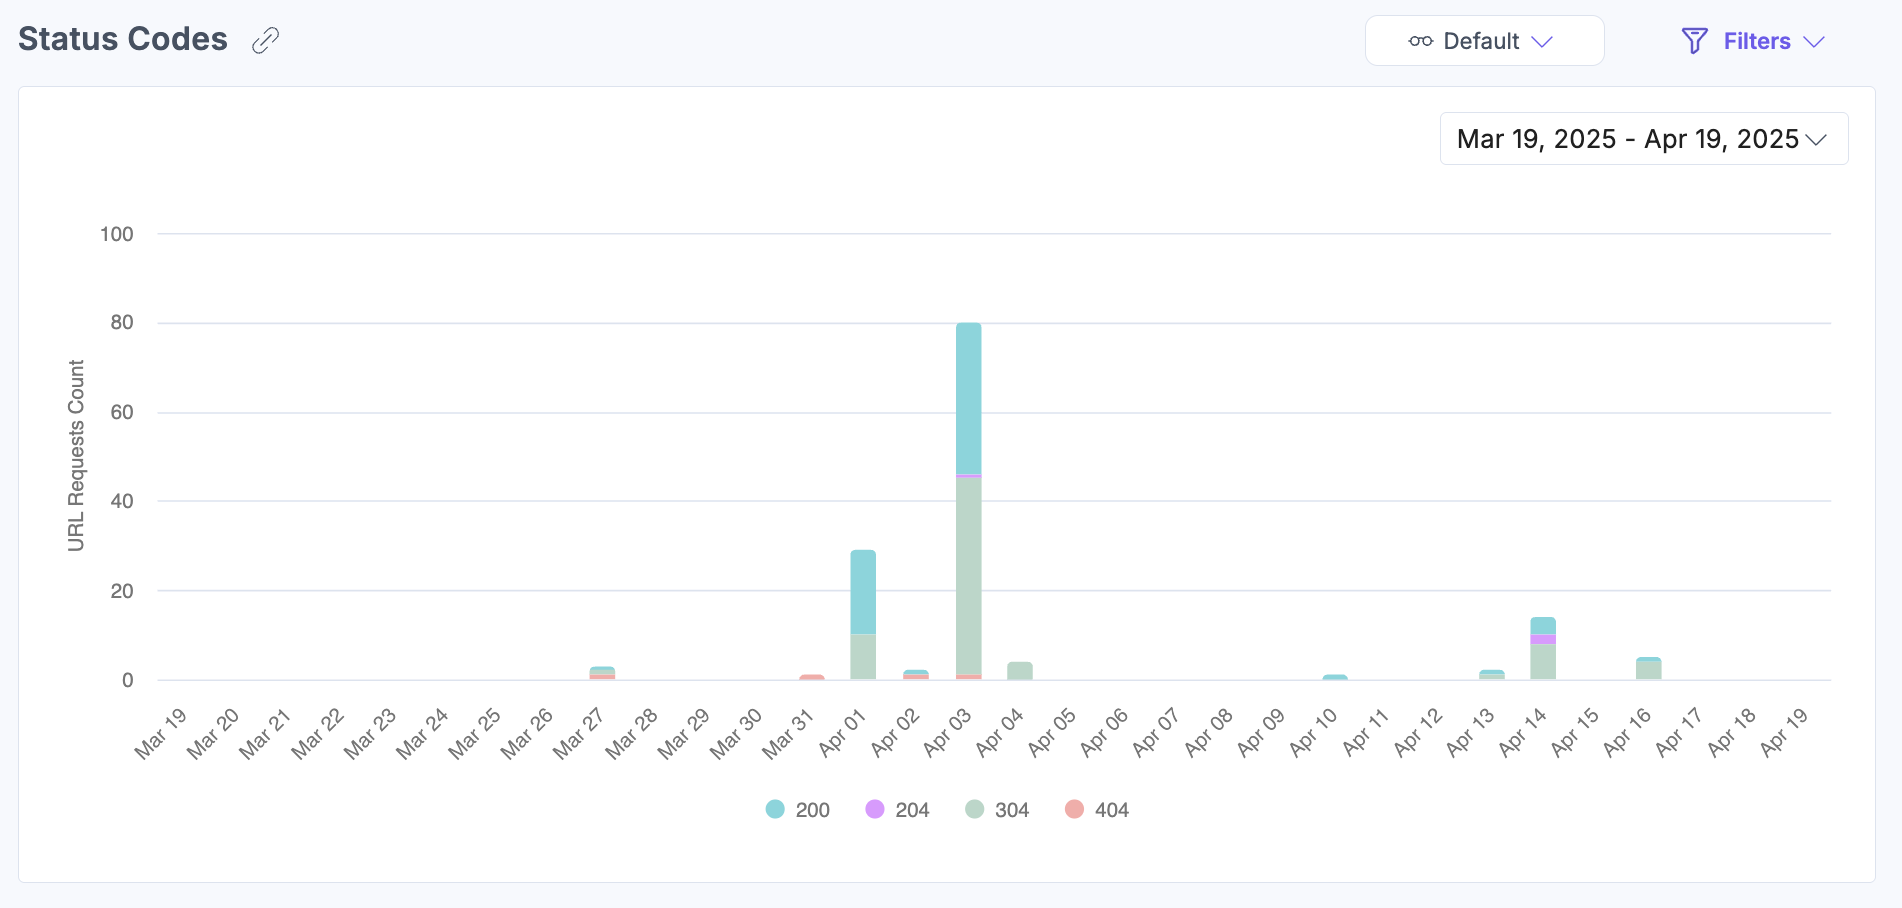
Status Codes
This section breaks down API call results by status (success, error, or unsupported) to support diagnostics.
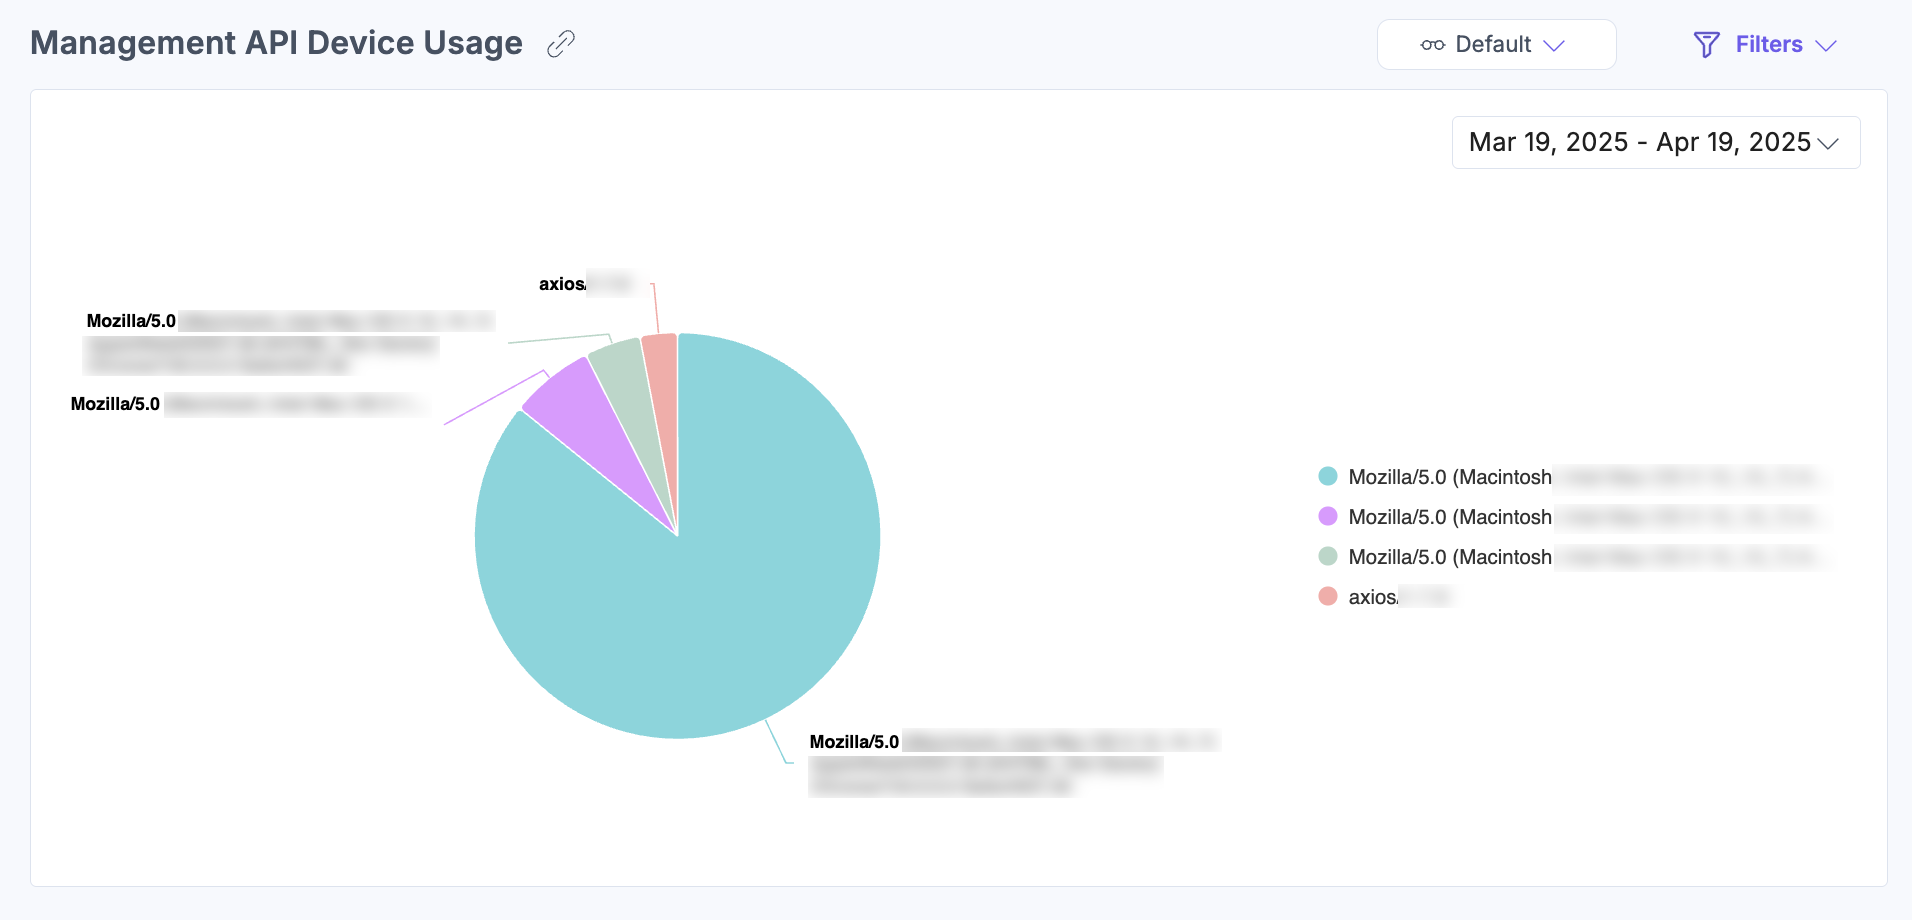
Management API Device Usage
This section shows the device types accessing the Personalize Management API, helping you understand user interaction environments.
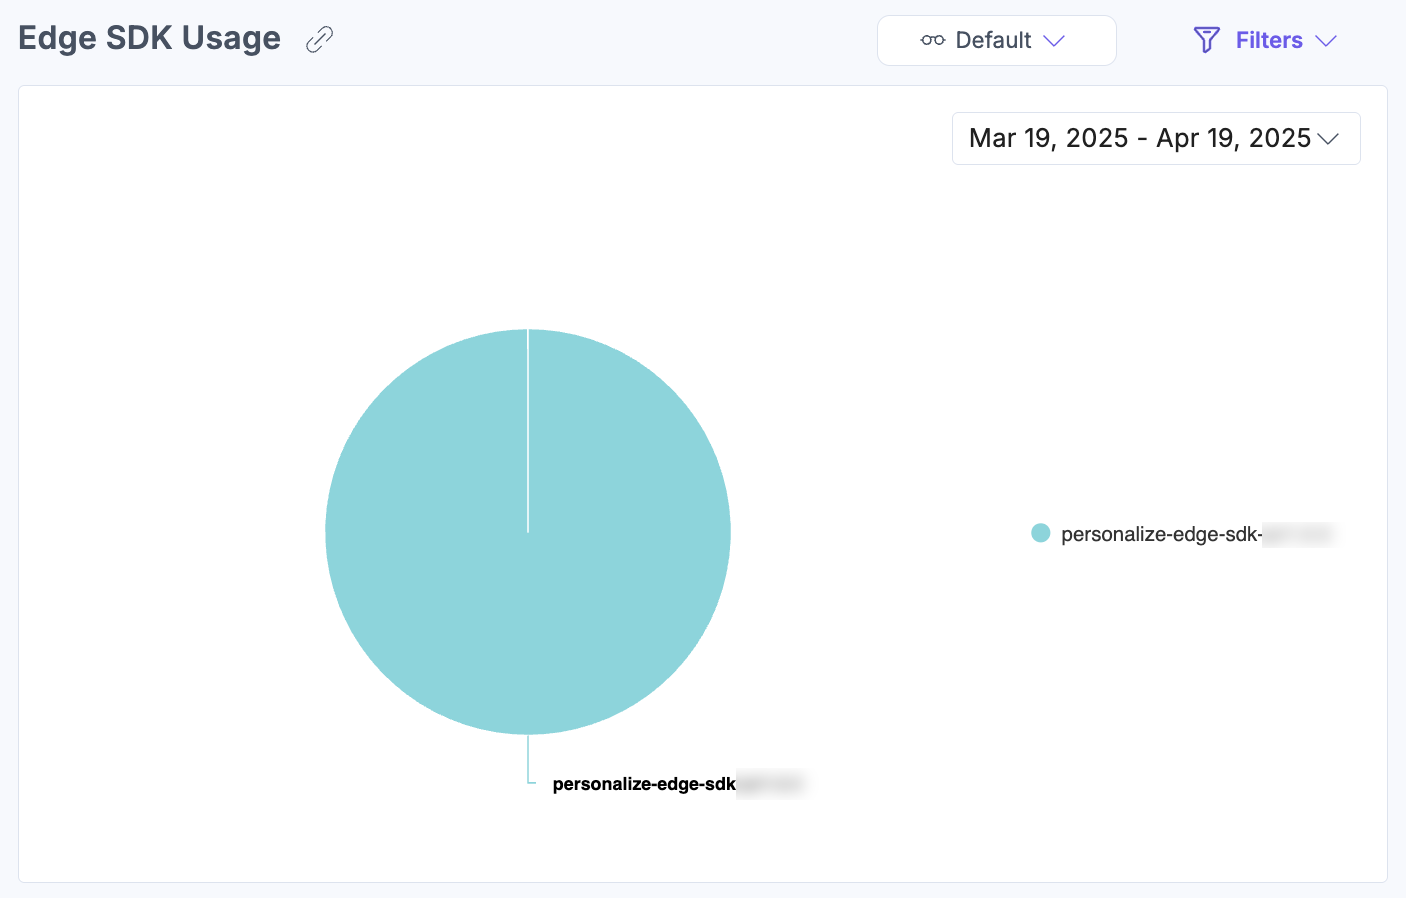
Edge SDK Usage
This section provides a pie chart summarizing Edge SDK consumption across different implementations.
The analytics dashboard for Personalize offers crucial insights into your personalization efforts and helps improve decision-making across your strategies.
Apply Filters and Manage Views
To filter dashboard data, click Filters, select your desired options, and then click Apply Filter(s).
The following filters are available:
-
Projects: Filter by individual or all projects.
-
Services: Filter API requests by all or specific services.
-
Subtypes: Filter data by Events, Manifest, or User Attributes.
-
Status Code: Show results for selected status codes.
-
Group By: Display data grouped by day, week, or month.
-
Date Range: Choose from predefined options (1 week, 30 days, 60 days, 90 days). Some graphs allow further range refinement.
-
Custom Date: Set a custom range using the dropdown.
Note: The custom date range cannot exceed 90 days.
If you regularly use the same filter combination, you can save it as a view. Click the horizontal ellipsis next to Reset and choose Save As New View.
Once saved, you can access the view from the dropdown menu without reapplying filters manually.
Related Resources
More articles in "Work with Analytics"
