

Analytics for Agents
The Agents Analytics dashboard shows how Contentstack Agents are used across your organization. Use it to monitor execution trends, token consumption, AI model adoption, and overall agent activity.
Contentstack Agents are automated systems built on four core components: triggers, instructions, tools, and AI model. They can reason, decide, and act across workflows.
Estimated reading time: 4 minutes
Skill level: Intermediate
Prerequisites
- Contentstack account
- Organization Owner or Admin permissions
What You Will Learn
-
How to navigate to the Agents Analytics dashboard.
-
What each dashboard section tracks and how to read it.
-
How to apply filters and save custom views.
Access the Agents Analytics dashboard
To access the Analytics dashboard, log in to your Contentstack account and perform the following steps:
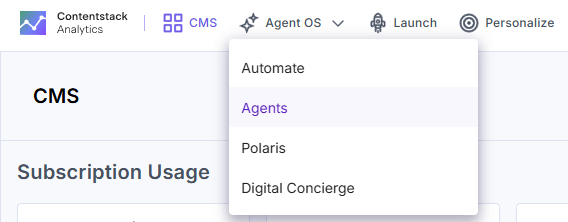
- Navigate to Analytics through the “App Switcher”.
- By default, the CMS analytics dashboard appears. Click Agent OS and then select Agents to switch dashboards.
Note: The data in the Agents dashboard updates in real-time, with a latency of 5–10 minutes.
Agents Analytics Dashboard Sections
The dashboard is divided into five sections. Each section covers a different aspect of agent activity and usage.
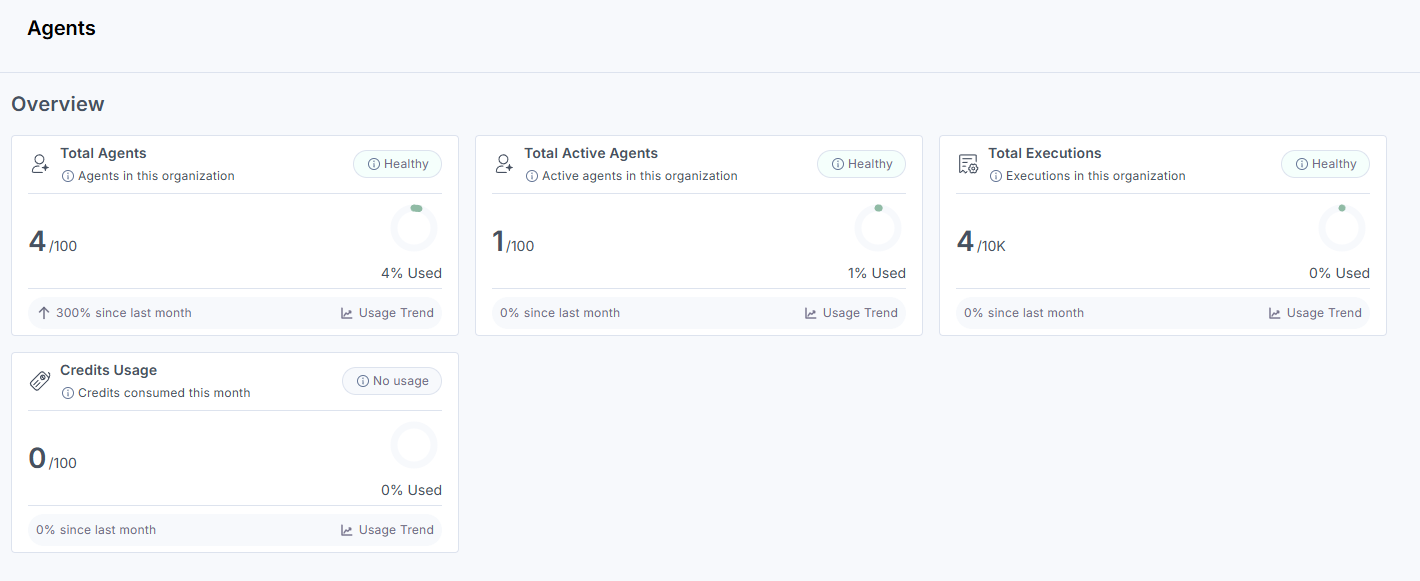
Overview
The Overview section provides a high-level snapshot of agent activity across your organization. It displays four summary cards:
-
Total Agents: the total number of agents configured in your organization.
-
Total Active Agents: the number of agents that have executed at least once in the selected date range.
-
Total Executions: the total number of agent runs in the selected date range.
-
Token Consumption: the total tokens consumed by agent executions. Tokens are units that measure AI model input and output consumption.
Use this section to quickly assess execution frequency and resource consumption across your organization.
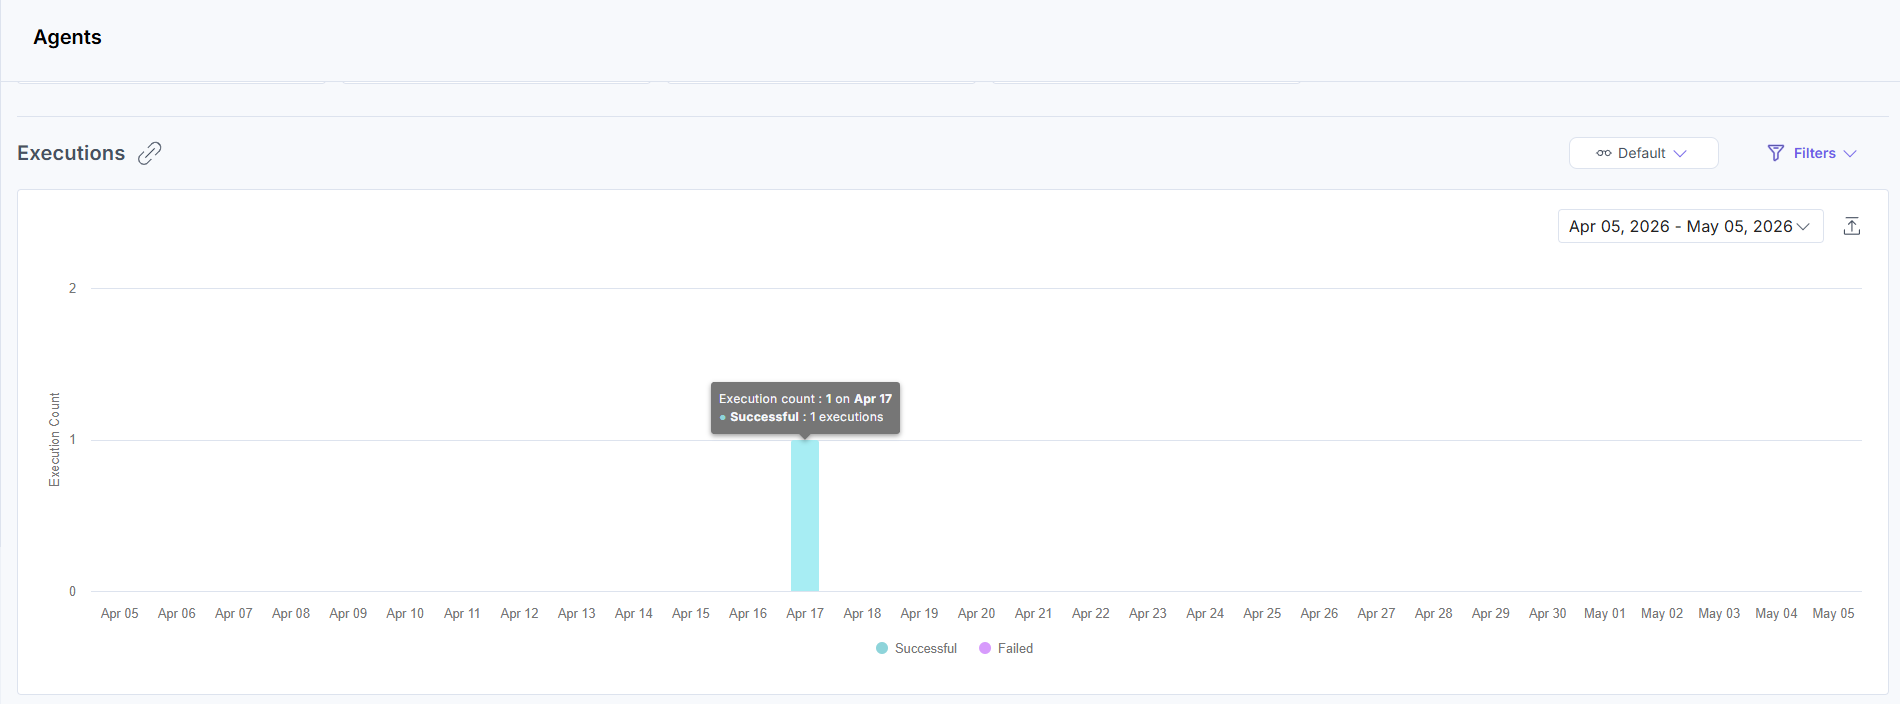
Executions
The Executions section displays the number of successful and failed agent executions over the selected date range as a daily bar chart. Use this section to monitor execution reliability, identify periods with higher failure rates, and track execution trends over time.
Agent Executions
The Agent Executions section displays execution details for individual agents. For each agent, it shows the AI model the agent is configured to use, the number of executions, and the total tokens consumed. Use this section to identify the most active agents, analyze AI model usage per agent, and monitor token consumption across agent configurations.
Note: If this chart appears identical to the Executions chart above, the screenshot asset may need to be updated. See Flag 1 in the production review notes.
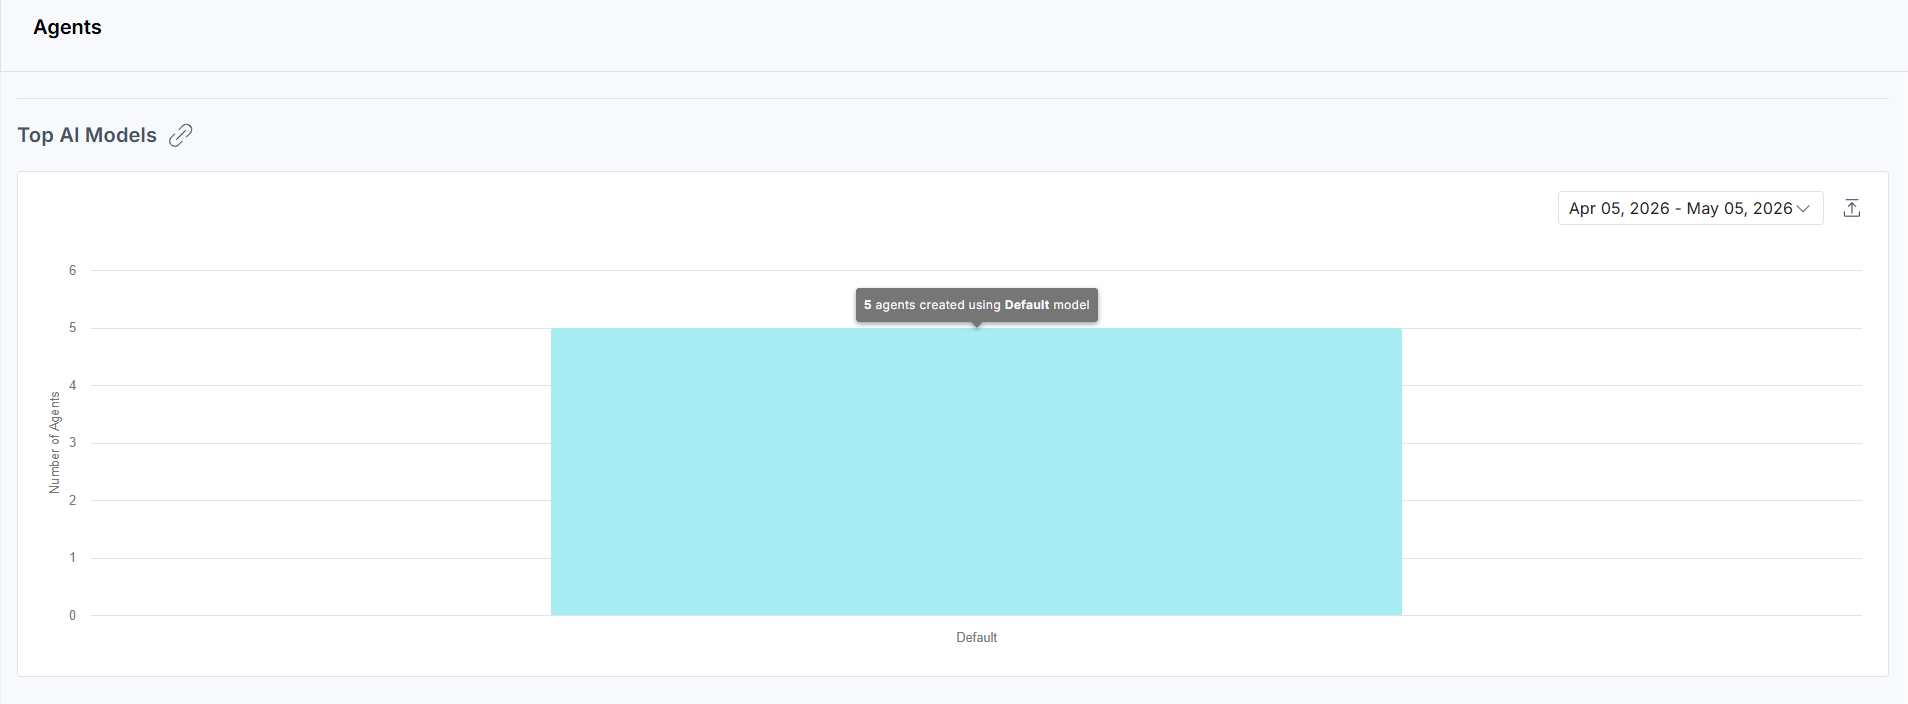
Top AI Models
The Top AI Models section displays the distribution of agents by AI model as a bar chart. Each bar represents one model and the number of agents built on it. Use this section to understand how AI model usage is distributed across your organization.
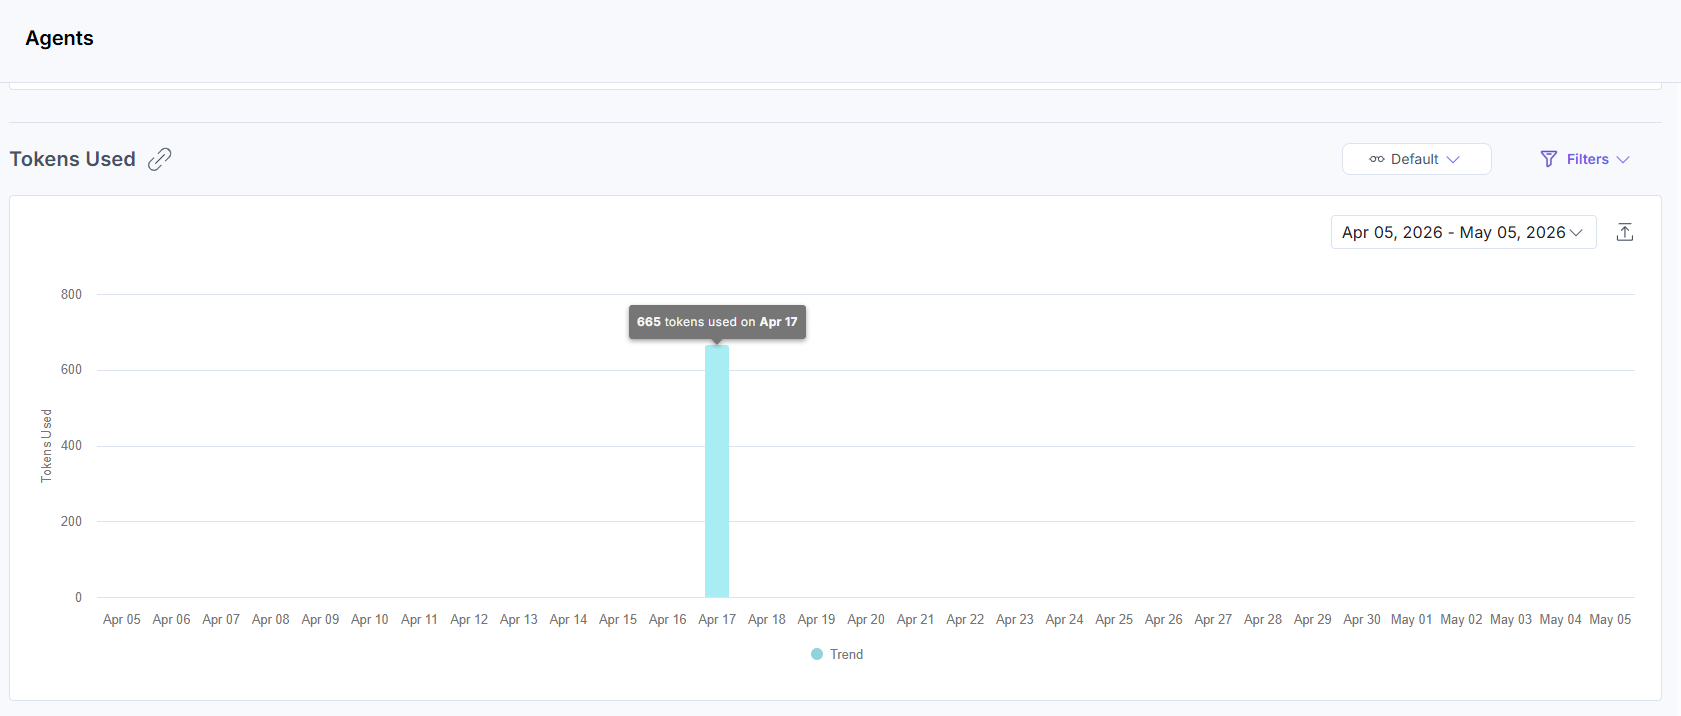
Tokens Used
The Tokens Used section displays the trend of total tokens consumed by agent executions over the selected date range as a daily bar chart. Use this section to monitor token usage trends, identify peak consumption periods, and track AI resource usage over time.
Apply Filters and Manage Views
To apply filters, click Filters, select your options, then click Apply Filter(s).
The following filters are available:
- Date Range: Choose from 1 week, 30 days (default), 60 days, or 90 days. Some charts include a timeline selector for further refinement.
- Custom Date: Set a custom date range using the dropdown.
Note: The custom date range should not exceed 90 days.
- Zoom: Switch between 1 week, 30 days, 60 days, or 90 days for trend analysis.
- Projects: View metrics for a specific project or all projects together.
- Group By: View data grouped by day, week, or month, depending on the selected section.
To save a specific filter for later use, click the horizontal ellipsis (...) beside Reset and choose Save As New View.
Once saved, your view appears in the dropdown menu for quick access, so you don’t need to reapply filters manually each time.
Related Resources
More articles in "Work with Analytics"
