

Analytics for Polaris
The Analytics dashboard for Polaris provides detailed insights into how Contentstack's built-in AI assistant is being used across your organization. Polaris can perform actions on entries, assets, and the Visual Editor on behalf of users. Use these metrics to monitor usage trends, response latency, token consumption, and execution success rates across Polaris operations.
Estimated reading time: 5 minutes
Skill level: Intermediate
Prerequisites
- Contentstack account
- Organization Owner or Admin permissions
What You Will Learn
-
How to navigate to the Polaris Analytics dashboard.
-
What each of the seven dashboard sections shows and when to use it.
-
How to apply filters, set date ranges, and save custom views.
Access the Polaris Analytics Dashboard
To access the analytics dashboard, log in to your Contentstack account and perform the following steps:
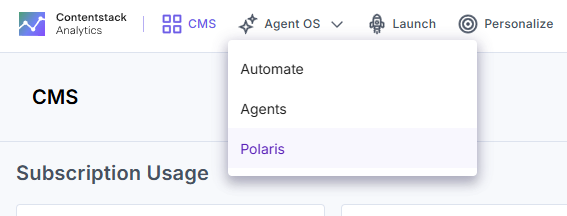
- Navigate to Analytics through the “App Switcher”.
- By default, the CMS analytics dashboard appears. Click Agent OS and then select Polaris to switch dashboards.
Note: The data in the Polaris dashboard updates in real-time, with a latency of 5–10 minutes.
Polaris Analytics Dashboard Sections
The dashboard is divided into several key sections, each providing insights into different aspects of Polaris usage and performance.
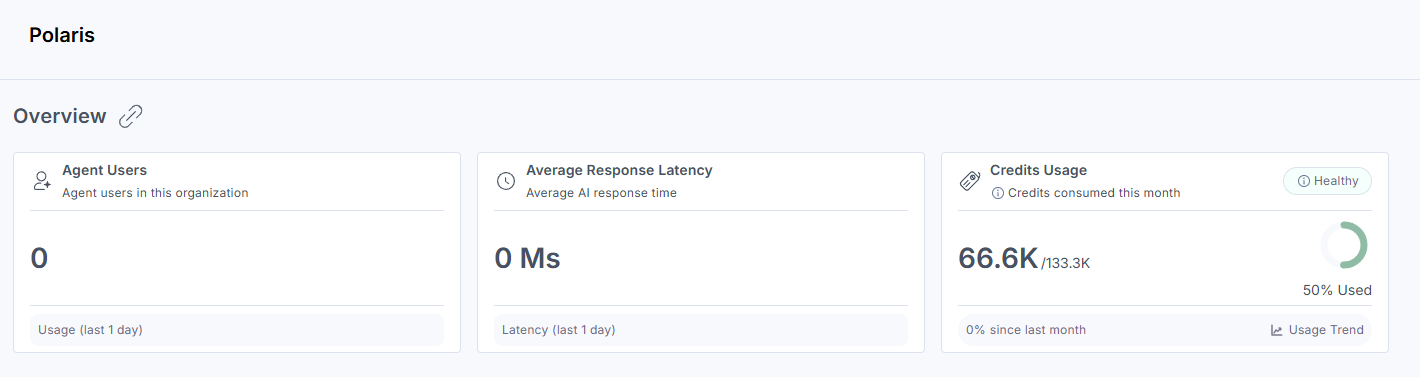
Overview
This section provides a high-level summary of Polaris activity within your organization. It highlights key metrics such as Active Users, Average Response Latency, and Token Consumption.
These summary cards help you quickly assess Polaris usage, response performance, and token consumption.
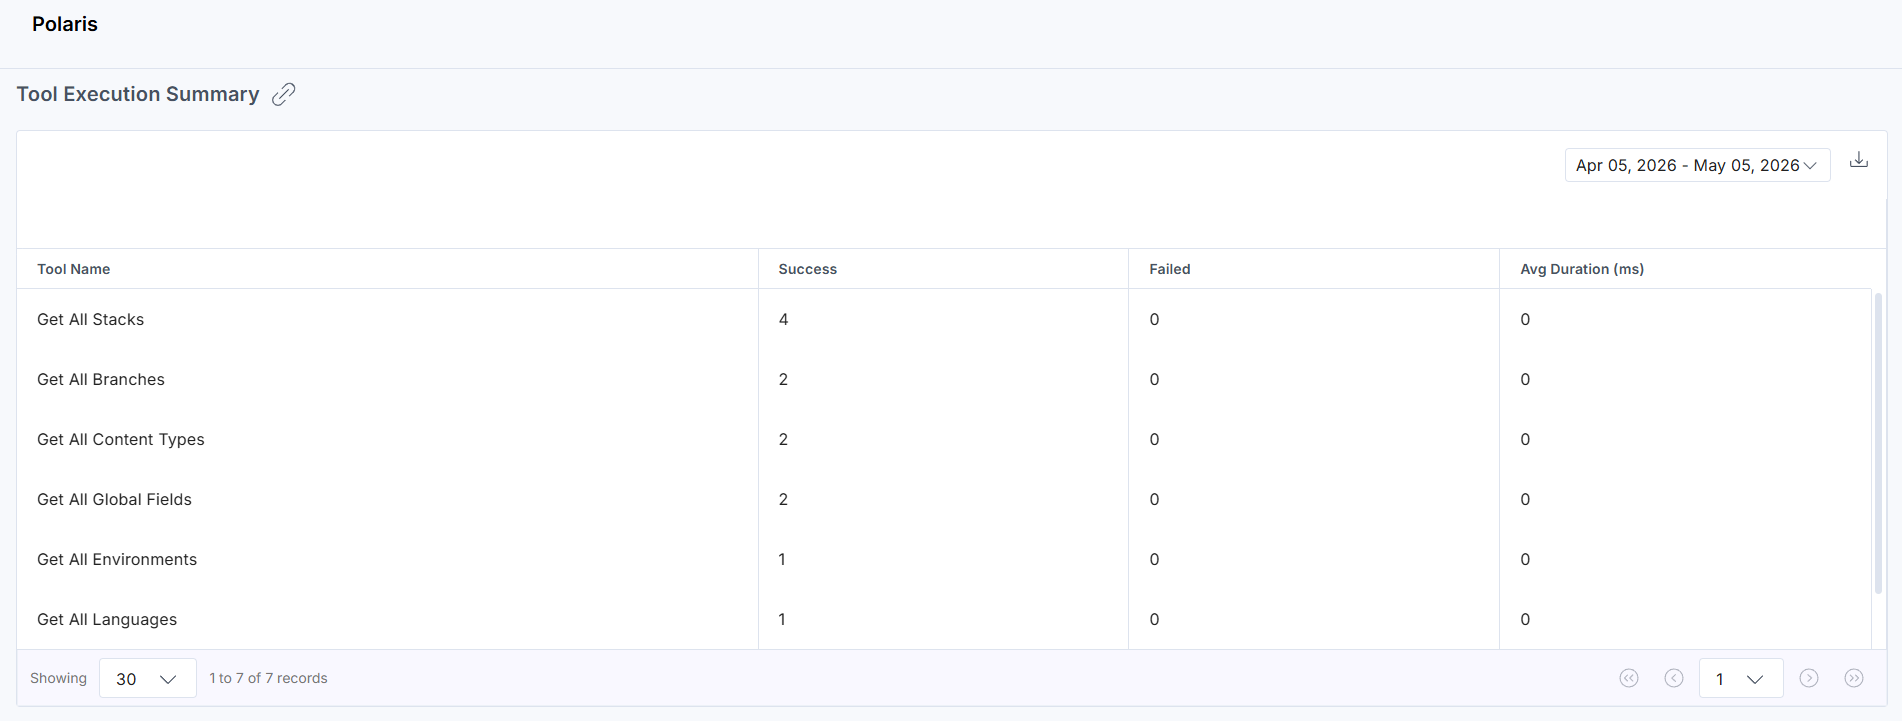
Tool Execution Summary
This section displays a table of all operations executed by Polaris within the selected date range. For each tool, it shows the number of successful executions, failed executions, and average duration in milliseconds.
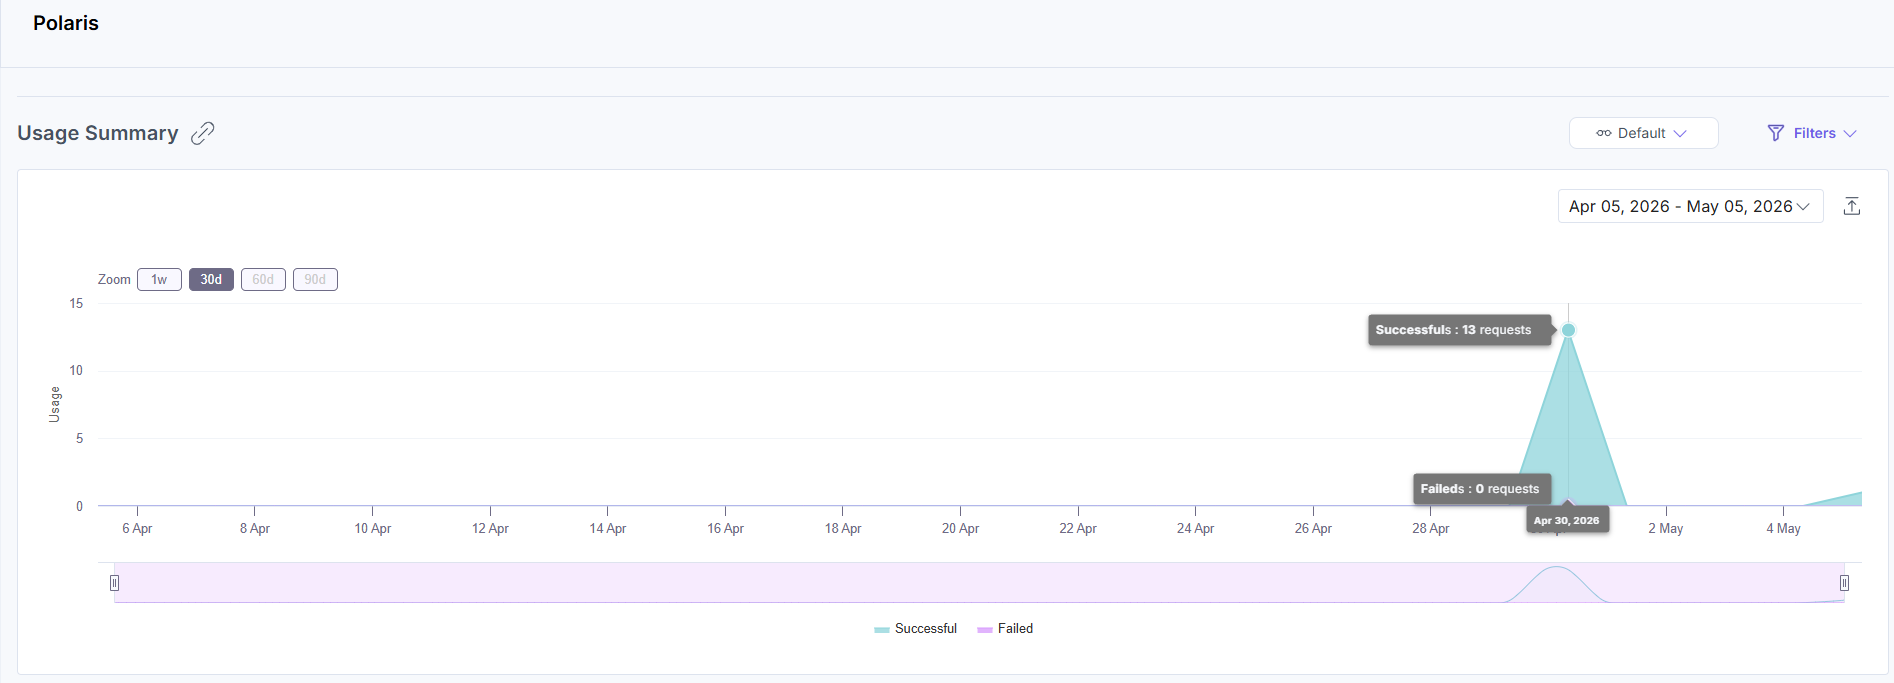
Usage Summary
This section displays the number of successful and failed Polaris requests over a selected time range. Use the zoom options (1w, 30d, 60d, 90d) and date selector to analyze request trends.
This view helps you understand how frequently users are invoking Polaris, identify spikes in activity, and track the overall success rate of requests over time.
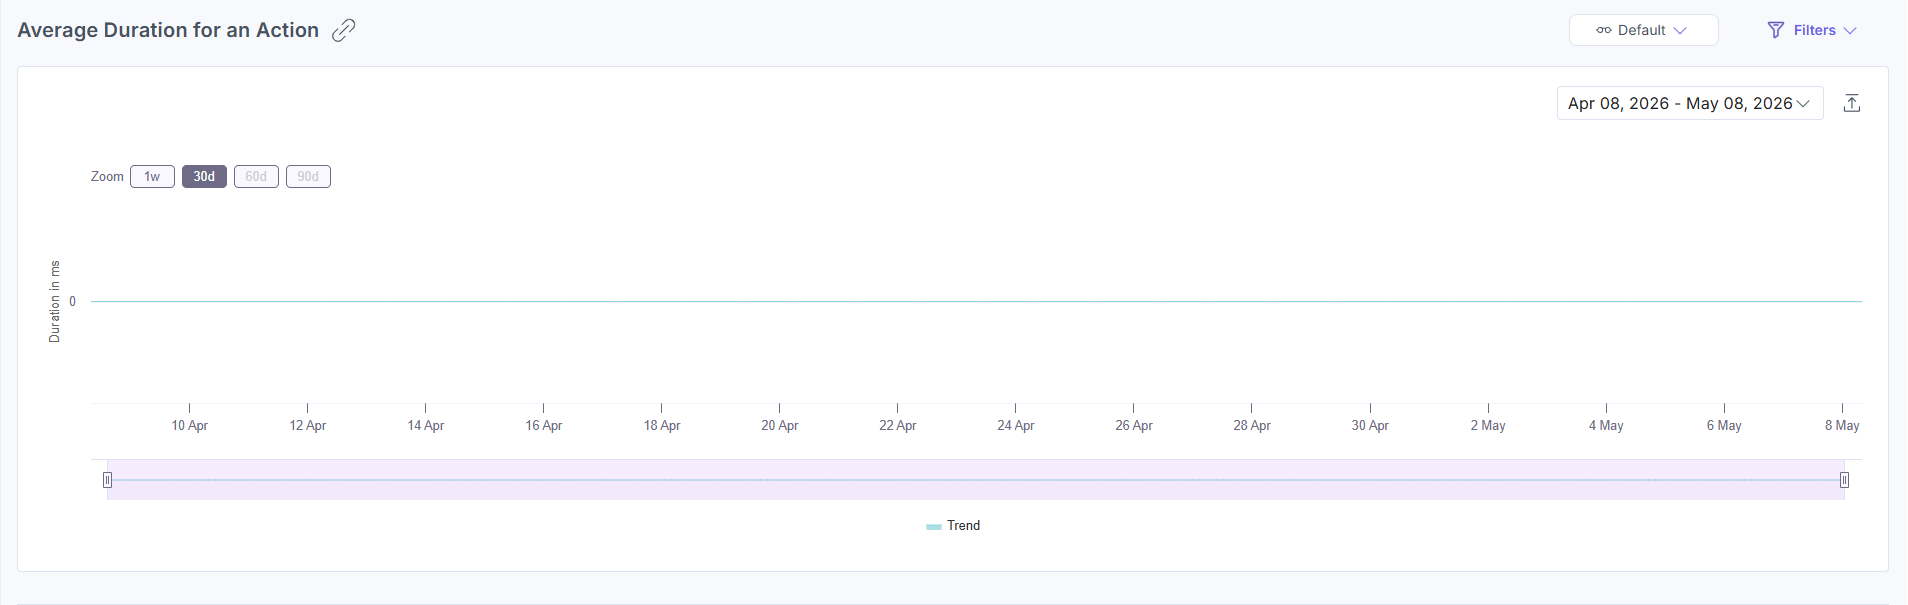
Average Duration for an Action
This section displays the trend of average response times for Polaris-executed actions over the selected time range. Use the zoom options (1w, 30d, 60d, 90d) and date selector to analyze latency trends.
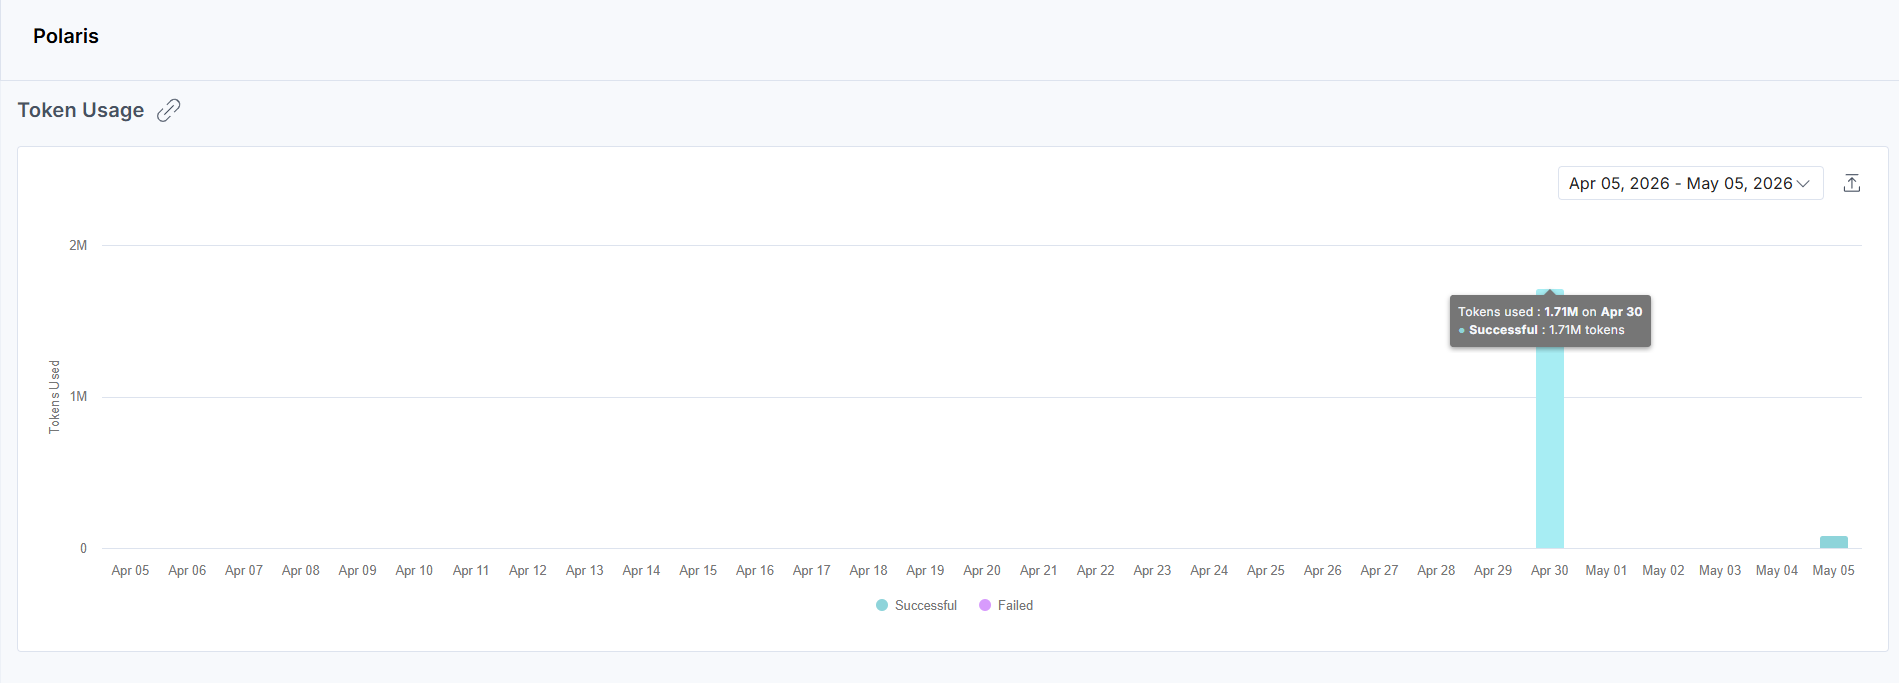
Token Usage
This section displays the total number of tokens consumed by Polaris within the selected date range, broken down by successful and failed requests and shown as a bar chart.
This view helps you monitor AI resource consumption tied specifically to Polaris operations, identify peak usage days, and manage token allocation across your organization.
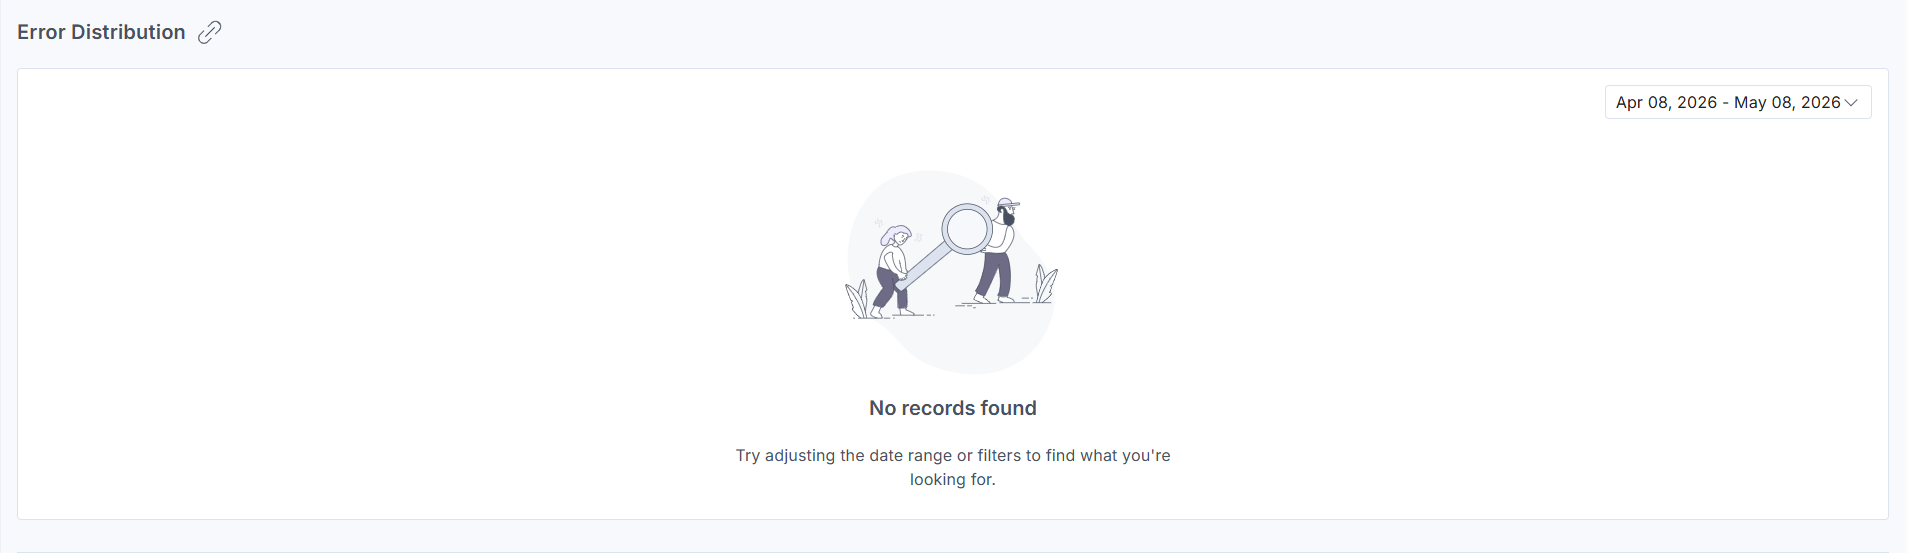
Error Distribution
This section helps you identify and categorize failures across Polaris operations.
This view supports troubleshooting by surfacing error patterns, such as permission-related failures or schema validation issues, helping teams address recurring problems. If no errors are found for the selected period, the section displays a “No records found” message.
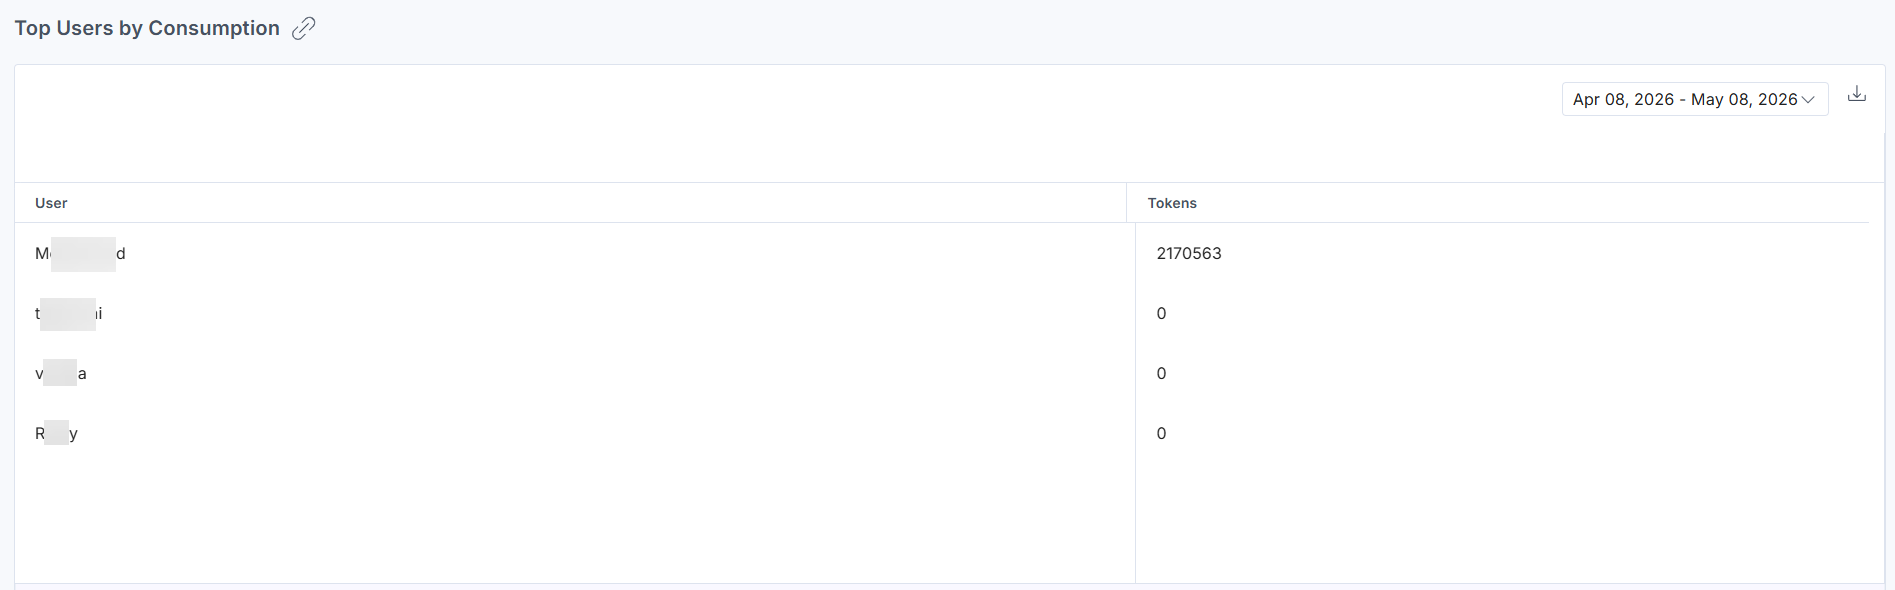
Top Users by Consumption
This section highlights the users who have consumed the highest number of tokens through Polaris interactions within the selected date range.
Since Polaris performs actions using the logged-in user’s credentials, this view helps you understand how AI usage is distributed across your team and identify the most active Polaris users.
Apply Filters and Manage Views
To apply filters, click Filters, select your options, then click Apply Filter(s).
The following filters are available:
- Date Range: Choose from 1 week, 30 days (default), 60 days, or 90 days. Some charts include a timeline selector for further refinement.
- Custom Date: Set a custom date range using the dropdown.
Note: The custom date range should not exceed 90 days.
- Zoom: Switch between 1 week, 30 days, 60 days, or 90 days for trend analysis.
- Group By: View data grouped by day, week, or month, depending on the selected section.
To save a specific filter for later use, click the horizontal ellipsis (...) beside Reset and choose Save As New View.
Once saved, your view appears in the dropdown menu for quick access, so you don’t need to reapply filters manually each time.
Related Resources
More articles in "Work with Analytics"
