

Analytics APINEW
[API VERSION : 2.0.0]Introduction
Base URL
- AWS North America (AWS NA): https://app.contentstack.com/
- AWS Europe (AWS EU): https://eu-app.contentstack.com/
- AWS Australia (AWS AU): https://au-app.contentstack.com/
- Azure North America (Azure NA): https://azure-na-app.contentstack.com/
- Azure Europe (Azure EU): https://azure-eu-app.contentstack.com/
- GCP North America (GCP NA): https://gcp-na-app.contentstack.com/
- GCP Europe (GCP EU): https://gcp-eu-app.contentstack.com/
Overview
Note: The Analytics API may not be enabled by default for your organization. Reach out to our support team to get it enabled.
The Product Analytics section provides an overview of how the users of your organization are using Contentstack. The Mission Control section allows developers to access log data (Status Code, Cache Usage, SDK Usages, and Device Usages) of your account and get an overview of your organization’s health.
Note: Only organization Owner and Admin roles can access these endpoints.
The v2 analytics APIs fetch data asynchronously. All requests, except Retrieve Data, under this section will return a jobId value in the response. You must use this jobId to fetch the actual data using the Retrieve Data endpoint.
Authentication
Contentstack uses the authtoken or OAuth token, API key, and Organization ID to make Analytics API requests.
How to Get Authtoken
Authtokens are user-specific tokens generated when user logs in to Contentstack. To retrieve the authtoken, log in to your Contentstack account by using the "Log in to your account" request. This request will return the authtoken in the response body.
You can generate multiple authtokens by executing the "Log in to your account" request multiple times. These tokens do not have an expiration time limit. However, currently, there is a maximum limit of 20 valid tokens that a user can use per account at a time, to execute CMA requests. If you already have valid 20 tokens, creating a new authtoken will automatically cause the oldest authtoken to expire without warning.
For SSO-enabled organizations, the "Log in to your account" request will not return the user authtoken for users who access the organization through Identity Provider login credentials. Consequently, any requests that require user authtoken will not work. Only the owner of the organization and users with permission to access the organization without SSO can use the Content Management APIs. Learn more about REST API Usage.
Tip: An alternate way to retrieve the authtoken is via Inspect element. If you are logged in through your browser, right-click and select Inspect or press “F12” to open developer tools, and select the Network tab.
M2M OAuth Token
Machine-to-Machine (M2M) apps are designed for secure server-to-server communication, eliminating the need for user intervention. These apps use the OAuth 2.0 protocol for authentication and authorization, making them highly secure and reliable for machine-to-machine interactions. Refer to our guide on Machine-to-Machine Apps for more information.
Note: The M2M app is currently in Beta. Reach out to our support team to enable it for your organization.
How to Get Stack API Key
To retrieve the stack API key, perform the steps given below:
- Go to your stack.
- Navigate to Settings > Stack.
- On the right-hand side of the page, under API Credentials, you will get the API Key of your stack.
Note: Only the developers, admins, and stack owners can view the API key.
How to Get Organization ID
To retrieve the Organization ID, perform the steps given below:
- Select the Organization from the dropdown on the header and click the “Org Admin” icon in the left navigation panel.
Or, you can simply click the “Org Admin” cog beside the Organization that you intend to open. - Click the Info tab to access the section.
Note: Only organization Owner and Admin roles can view the Organization ID.
Rate limiting
Rate limit is the maximum number of requests you can make using Contentstack’s API in a given time period.
By default, the Analytics API enforces 10 GET requests per second per organization.
Your application will receive the HTTP 429 response code if the requests for a given time period exceed the defined rate limits.
To get the current rate limit status, you can check the returned HTTP headers of any API request. These rate limits are reset at the start of each time period.
| Headers | Description |
|---|---|
| X-RateLimit-Limit | The maximum number of request a client is allowed to make per second per organization. |
| X-RateLimit-Remaining | The number of requests remaining in the current time period. |
API conventions
- The base URL for Analytics API for different regions can be found in the Base URL section.
- URL paths are written in lower case.
- Query parameters and JSON fields use lower case, with underscores (_) separating words.
- The success/failure status of an operation is determined by the HTTP status it returns. Additional information is included in the HTTP response body.
- The JSON number type is bounded to a signed 32-bit integer.
Errors
If there is something wrong with the API request, Contentstack returns an error.
Contentstack uses conventional, standard HTTP status codes for errors, and returns a JSON body containing details about the error. In general, codes in the 2xx range signify success. The codes in the 4xx range indicate error, mainly due to information provided (for example, a required parameter or field was omitted). Lastly, codes in the 5xx range mean that there is something wrong with Contentstack’s servers; it is very rare though.
Let’s look at the error code and their meanings.
| HTTP status code | Description |
|---|---|
| 400 Bad Request | The request was incorrect or corrupted. |
| 401 Access Denied | The login credentials are invalid. |
| 403 Forbidden Error | The page or resource that is being accessed is forbidden. |
| 404 Not Found | The requested page or resource could not be found. |
| 412 Pre Condition Failed | The entered API key is invalid. |
| 422 Unprocessable Entity (also includes Validation Error and Unknown Field) | The request is syntactically correct but contains semantic errors. |
| 429 Rate Limit Exceeded | The number of requests exceeds the allowed limit for the given time period. |
| 500 Internal Server Error | The server is malfunctioning and is not specific on what the problem is. |
| 500 Job Failed | The date range for the from and to parameters must be within 90 days. If the range exceeds 90 days, you will receive a 500 Job Failed error response. |
| 502 Bad Gateway Error | A server received an invalid response from another server. |
| 200 Job active | The job is still processing. Retry the request after some time to receive the desired response. |
Note: The error codes that we get in the JSON response are not HTTP error codes but are custom Contentstack error codes that are used for internal purposes.
Using Postman Collection
Contentstack offers you a Postman Collection that helps you try out our Analytics API. You can download this collection, connect to your Contentstack account, and try out the Analytics API with ease.
Learn more about how to get started with using the Postman Collection for Contenstack Analytics API.
API Reference
Subscription Usage
The Subscription Usage request returns the total number of projects, environments, and domains under Launch within your organization till date. To get the details for CMS and Automate, you can use the Usage Analytics request.
Here’s how your response body would look like when you pass the jobId in the Retrieve Data endpoint.
{
    "data": [
        {
            "total_launch_project": 9,
            "total_launch_env": 11,
            "total_launch_domain": 2
        }
    ],
    "meta": {
        "orgUid": "blt**************87",
        "from": "2024-06-30",
        "to": "2024-09-12"
    },
    "uid": "0f****46-5ee9-4f38-9146-1f********87"
}
The response body provides an overview of the resources in the Launch section within your organization. Here’s a breakdown of the key elements:
- total_launch_project: The total number of projects created within Launch.
- total_launch_env: The total number of environments associated with the Launch projects .
- total_launch_domain: The total number of domains configured within Launch.
This response gives a clear view of how Launch resources are utilized within the specified date range.
Device Usage
The Device Usage request helps you track the device usage of your customers. You will get a list of servers that your customers are using to access your website/services.
Here’s how your response body would look like when you pass the jobId in the Retrieve Data endpoint.
{
    "total": 352,
    "totalDocs": 26,
    "data": [
        {
            "count": 164,
            "type": "cma",
            "device": "sdk contentstack-management-javascript/1.13.0; platform node.js/v18.17.1; os Linux/5.4.176-91.338.amzn2.x86_64;",
            "date": "2024-03-05"
        },
        {
            "count": 62,
            "type": "cma",
            "device": "sdk contentstack-management-javascript/1.13.0; platform node.js/v18.17.1; os Windows/10.0.22000;",
            "date": "2024-02-05"
        },
        {
            "count": 18,
            "type": "cma",
            "device": "sdk contentstack-management-javascript/1.13.0; platform node.js/v18.17.1; os Linux/5.4.176-91.338.amzn2.x86_64;",
            "date": "2024-03-22"
        },
        {
            "count": 16,
            "type": "cma",
            "device": "sdk contentstack-management-javascript/1.13.0; platform node.js/v18.17.1; os Linux/5.4.176-91.338.amzn2.x86_64;",
            "date": "2024-03-04"
        },
        {
            "count": 10,
            "type": "cma",
            "device": "PostmanRuntime/7.37.0",
            "date": "2024-03-20"
        },
        ...
        {
            "date": "2024-03-31"
        }
    ],
    "meta": {
        "orderBy": -1,
        "orgUid": "blt**************87",
        "includeCount": true,
        "from": "2024-01-31",
        "duration": "day",
        "to": "2024-03-31",
        "services": "[\"cdn\",\"cma\"]",
        "skip": 0,
        "limit": 900
    },
    "uid": "35****12-acf4-4ad5-93e0-48********0e"
}
The response body provides detailed insights into customers accessing your website or services. Here’s a breakdown of the key elements:
- count: Number of times the specific device was used.
- type: The type of access, such as "cma" for Content Management API.
- device: Description of the device or software used, including the SDK version, platform, and operating system details.
- date: The specific date when the usage was recorded.
This data helps you track and analyze device and environment usage, supporting performance and user experience optimization.
Usage Analytics
The Usage Analytics request gives a quick usage overview of your bandwidth and API utilization over a particular period of time.
Here’s how your response body would look like when you pass the jobId in the Retrieve Data endpoint.
{
    "data": [
        {
            "total_api_bandwidth": 0,
            "total_api_count": 0,
            "total_cdn_bandwidth": 0,
            "total_cdn_count": 0,
            "date": "2024-03-02"
        },
        {
            "total_api_bandwidth": 0,
            "total_api_count": 0,
            "total_cdn_bandwidth": 10110,
            "total_cdn_count": 4,
            "date": "2024-02-12"
        },
        {
            "total_api_bandwidth": 0,
            "total_api_count": 0,
            "total_cdn_bandwidth": 0,
            "total_cdn_count": 0,
            "date": "2024-02-22"
        },
        {
            "total_api_bandwidth": 0,
            "total_api_count": 0,
            "total_cdn_bandwidth": 0,
            "total_cdn_count": 0,
            "date": "2024-03-25"
        },
        {
            "total_api_bandwidth": 94685,
            "total_api_count": 26,
            "total_cdn_bandwidth": 0,
            "total_cdn_count": 0,
            "date": "2024-03-04"
        },
        {
            "total_api_bandwidth": 0,
            "total_api_count": 0,
            "total_cdn_bandwidth": 0,
            "total_cdn_count": 0,
            "date": "2024-02-28"
        }
    ],
    "meta": {
        "orgUid": "blt**************87",
        "includeCount": "true",
        "from": "2024-01-31",
        "duration": "day",
        "to": "2024-03-31",
        "services": "[\"cdn\",\"cma\"]"
    },
    "uid": "0f****46-5ee9-4f38-9146-1f********8"
}
The response body provides detailed insights into your organization's API and CDN usage over a specified period. Here’s a breakdown of the key elements:
- total_api_bandwidth: The total bandwidth consumed by API requests on the specified date.
- total_api_count: The number of API requests executed on the specified date.
- total_cdn_bandwidth: The total bandwidth consumed by CDN requests on the specified date.
- total_cdn_count: The number of CDN requests made on the specified date.
- date: The specific date for the reported statistics.
This data helps monitor and analyze the usage patterns of API and CDN resources, aiding in efficient resource management and planning.
- The apiKey cannot be used with the services ["automations", "launch"] simultaneously.
- The apiKey and environmentUid parameters are only applicable to the ["launch"] service.
Top URLs
The Top URLs request gets you the number of requests made from your URLs for the given services.
Here’s how your response body would look like when you pass the jobId in the Retrieve Data endpoint.
{
    "data": [
        {
            "url": "https://cdn.contentstack.io/v3/content_types?include_count=false",
            "type": "cdn",
            "count": "3"
        },
        {
            "url": "https://cdn.contentstack.io/v3/content_types/header/entries/blt63c1bee28ce24ab1?environment=development",
            "type": "cdn",
            "count": "1"
        },
        {
            "url": "https://cdn.contentstack.io/v3/global_fields",
            "type": "cdn",
            "count": "1"
        },
        {
            "url": "https://cdn.contentstack.io/v3/content_types/test_111222/entries?environment=development",
            "type": "cdn",
            "count": "1"
        }
    ],
    "urlDataSource": "athena",
    "meta": {
        "orgUid": "blt**************87",
        "from": "2024-01-31",
        "duration": "day",
        "to": "2024-03-31",
        "services": "[\"cdn\"]",
        "skip": 0,
        "limit": 900
    },
    "uid": "0f****46-5ee9-4f38-9146-1f********8"
}
The response body provides a detailed summary of the number of requests made to various URLs over a specific period. Here’s a breakdown of the key elements:
- url: The specific URL that was accessed.
- type: The service type of the URL, such as "cdn".
- count: The number of requests made to this URL.
This data helps organizations monitor traffic, identify frequently accessed URLs, and optimize performance.
Status Code
The Status Code request will show the count for the number of API requests made for each HTTP status code. For example, 200, 201, 400, 404, and so on. You can use the httpStatusCode parameter to get the count for a specific status code instead of all status codes.
Here’s how your response body would look like when you pass the jobId in the Retrieve Data endpoint.
{
    "data": [
        {
            "count": 63,
            "type": "cma",
            "status": "200",
            "date": "2024-02-05"
        },
        {
            "count": 1,
            "type": "cma",
            "status": "422",
            "date": "2024-03-05"
        },
        {
            "count": 14,
            "type": "cma",
            "status": "200",
            "date": "2024-03-21"
        },
        {
            "count": 10,
            "type": "cma",
            "status": "200",
            "date": "2024-02-15"
        },
        {
            "date": "2024-03-31",
            "count": 0
        }
    ],
    "meta": {
        "from": "2024-01-31",
        "to": "2024-03-31",
        "duration": "day",
        "orgUid": "blt**************87",
        "services": "[\"cdn\",\"cma\"]"
    },
    "uid": "0f****46-5ee9-4f38-9146-1f********8"
}
The response body provides detailed statistics on the number of API requests executed for each HTTP status code over a specified period. Here’s a breakdown of the key elements:
- count: The total number of API requests that resulted in the corresponding HTTP status code.
- type: The service type (e.g., "cma") that made the requests.
- status: The HTTP status code (e.g., "200" for success, "422" for client error).
- date: The date on which the requests were executed.
This information helps you monitor the frequency of specific HTTP status codes and track the performance and errors of your API requests.
Cache Usage
The Cache Usage request will show the number of HIT/MISS instances for your cache. Number of HIT indicates that responses were received from the cache and MISS indicates the number of responses retrieved from the database.
Here’s how your response body would look like when you pass the jobId in the Retrieve Data endpoint.
{
    "data": [
        {
            "count": 7,
            "type": "cdn",
            "status": "MISS",
            "date": "2024-02-09"
        },
        {
            "count": 1,
            "type": "cdn",
            "status": "HIT",
            "date": "2024-02-08"
        },
        {
            "count": 2,
            "type": "cdn",
            "status": "MISS",
            "date": "2024-02-15"
        },
        {
            "count": 2,
            "type": "cdn",
            "status": "MISS",
            "date": "2024-02-08"
        },
        {
            "count": 4,
            "type": "cdn",
            "status": "MISS",
            "date": "2024-02-12"
        },
        {
            "date": "2024-03-31",
            "count": 0
        }
    ],
    "meta": {
        "orgUid": "blt**************87",
        "includeCount": "true",
        "services": "[\"cdn\",\"cma\"]",
        "from": "2024-01-31",
        "duration": "day",
        "to": "2024-03-31"
    },
    "uid": "0f****46-5ee9-4f38-9146-1f********8"
}
The response body provides insights into how effectively the cache is being utilized for the specified services. Here’s a breakdown of the key elements:
- count: The number of instances for the specified cache status (HIT or MISS).
- type: The service type (e.g., "cdn") being tracked for cache usage.
- status: Indicates whether the cache request was a "HIT" (response received from cache) or "MISS" (response retrieved from the database).
- date: The date when the cache status was recorded.
This information helps analyze cache efficiency by detailing the number of HITs and MISSes, aiding in optimizing the cache strategy and understanding cache utilization.
SDK Usage
The SDK Usage request gets you the number of requests that were made using the SDKs. It helps you get an overview of the SDK usage by your customers.
Here’s how your response body would look like when you pass the jobId in the Retrieve Data endpoint.
{
    "total": 16,
    "totalDocs": 4,
    "data": [
        {
            "count": 7,
            "type": "cdn",
            "sdk": "cda-collection/v9.31.0",
            "date": "2024-02-09"
        },
        {
            "count": 4,
            "type": "cdn",
            "sdk": "cda-collection/v9.31.0",
            "date": "2024-02-12"
        },
        {
            "count": 3,
            "type": "cdn",
            "sdk": "cda-collection/v9.31.0",
            "date": "2024-02-08"
        },
        {
            "count": 2,
            "type": "cdn",
            "sdk": "cda-collection/v9.31.0",
            "date": "2024-02-15"
        },
        {
            "date": "2024-02-28"
        }
    ],
    "meta": {
        "orderBy": -1,
        "from": "2024-01-31",
        "to": "2024-02-28",
        "orgUid": "blt**************87",
        "includeCount": true,
        "services": "[\"cdn\",\"cma\"]",
        "duration": "day",
        "skip": 0,
        "limit": 900
    },
    "uid": "0f****46-5ee9-4f38-9146-1f********8"
}
The response body provides detailed insights into how SDKs are being used across different services. Here’s a breakdown of the key elements:
- count: The number of requests executed using a specific SDK on a given date.
- type: The service type, such as "cdn".
- sdk: The SDK version used for the requests.
- date: The date when the SDK requests were executed.
This response helps organizations track SDK adoption and effectiveness by revealing usage patterns and frequency.
Retrieve Data
The Retrieve Data request will take the jobId value that was generated in your response, as a part of its URL and will get you the actual response data for that jobId without any processing delay. Due to the async nature of the APIs, this GET data request acts as an additional step to retrieve your actual response.
- Replace the jobId value in your URL with the jobId value received in your response. For example: {{api_server}}/analytics/v2/job/job_0******9-b**d-4**b-9**0-4**********2/data
- The page parameter is optional. If not provided, the response defaults to page 0. If paginated is true in the response, specify a page number (0, 1, 2, etc.) to get data for that page. An invalid page number will result in an error.
- A 200 Job active response indicates that the job is still processing. Retry the request after some time to receive the desired response body.
You will receive the response depending on your request and relevant jobId.
Postman Collection
About Postman Collection
The Postman collection is a set of preconfigured REST API requests that will make it easy for you to get started with the Contentstack APIs and try out our API requests through the popular Postman REST client.
Install Postman
To use the Postman collection you will need to have the Postman app. You can either download the Desktop app or use Postman for Web.
Note: If you have already installed Postman for your device, go to the Download Latest Postman Collection section.
Postman is available for Windows (x64), Mac (Intel Chip / Apple Chip), and Linux environments.
Download Latest Collection
Once you have installed Postman on your device, click the Run in Postman button to start working with the REST API endpoints for Contentstack.
Note: The Postman collection does not support the now deprecated Postman Chrome extension. Make sure you have installed the latest version of the Postman desktop app.
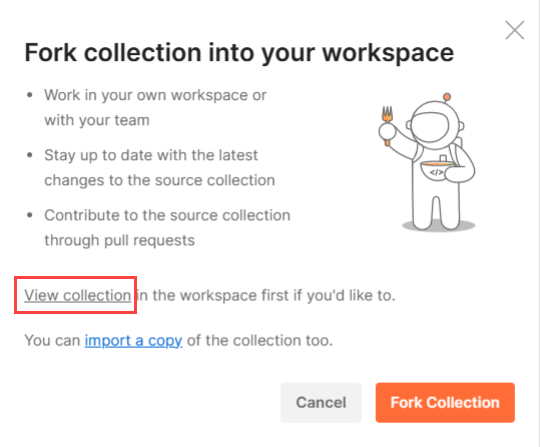
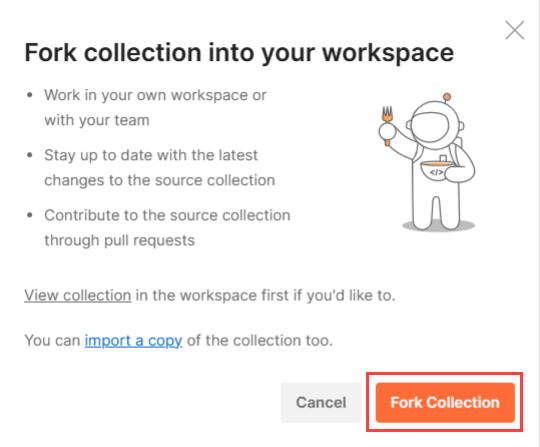
This opens the Fork collection into your workspace modal from where you can proceed to download/work with the Postman collection in the following three ways:
- View the Collection
- Import a Copy of the Collection
- Fork the Collection
- Download Collection from GitHub Page
Let’s look at each of the above methods in detail.
View the Collection
This option allows you to just view (and not try out) the API requests of the Postman collection.
Perform the following steps to view the Analytics API Postman collection:
- Click the View collection link in the Fork collection into your workspace modal.
A new tab opens up in your browser where you should see the latest collection preloaded in the left navigation.
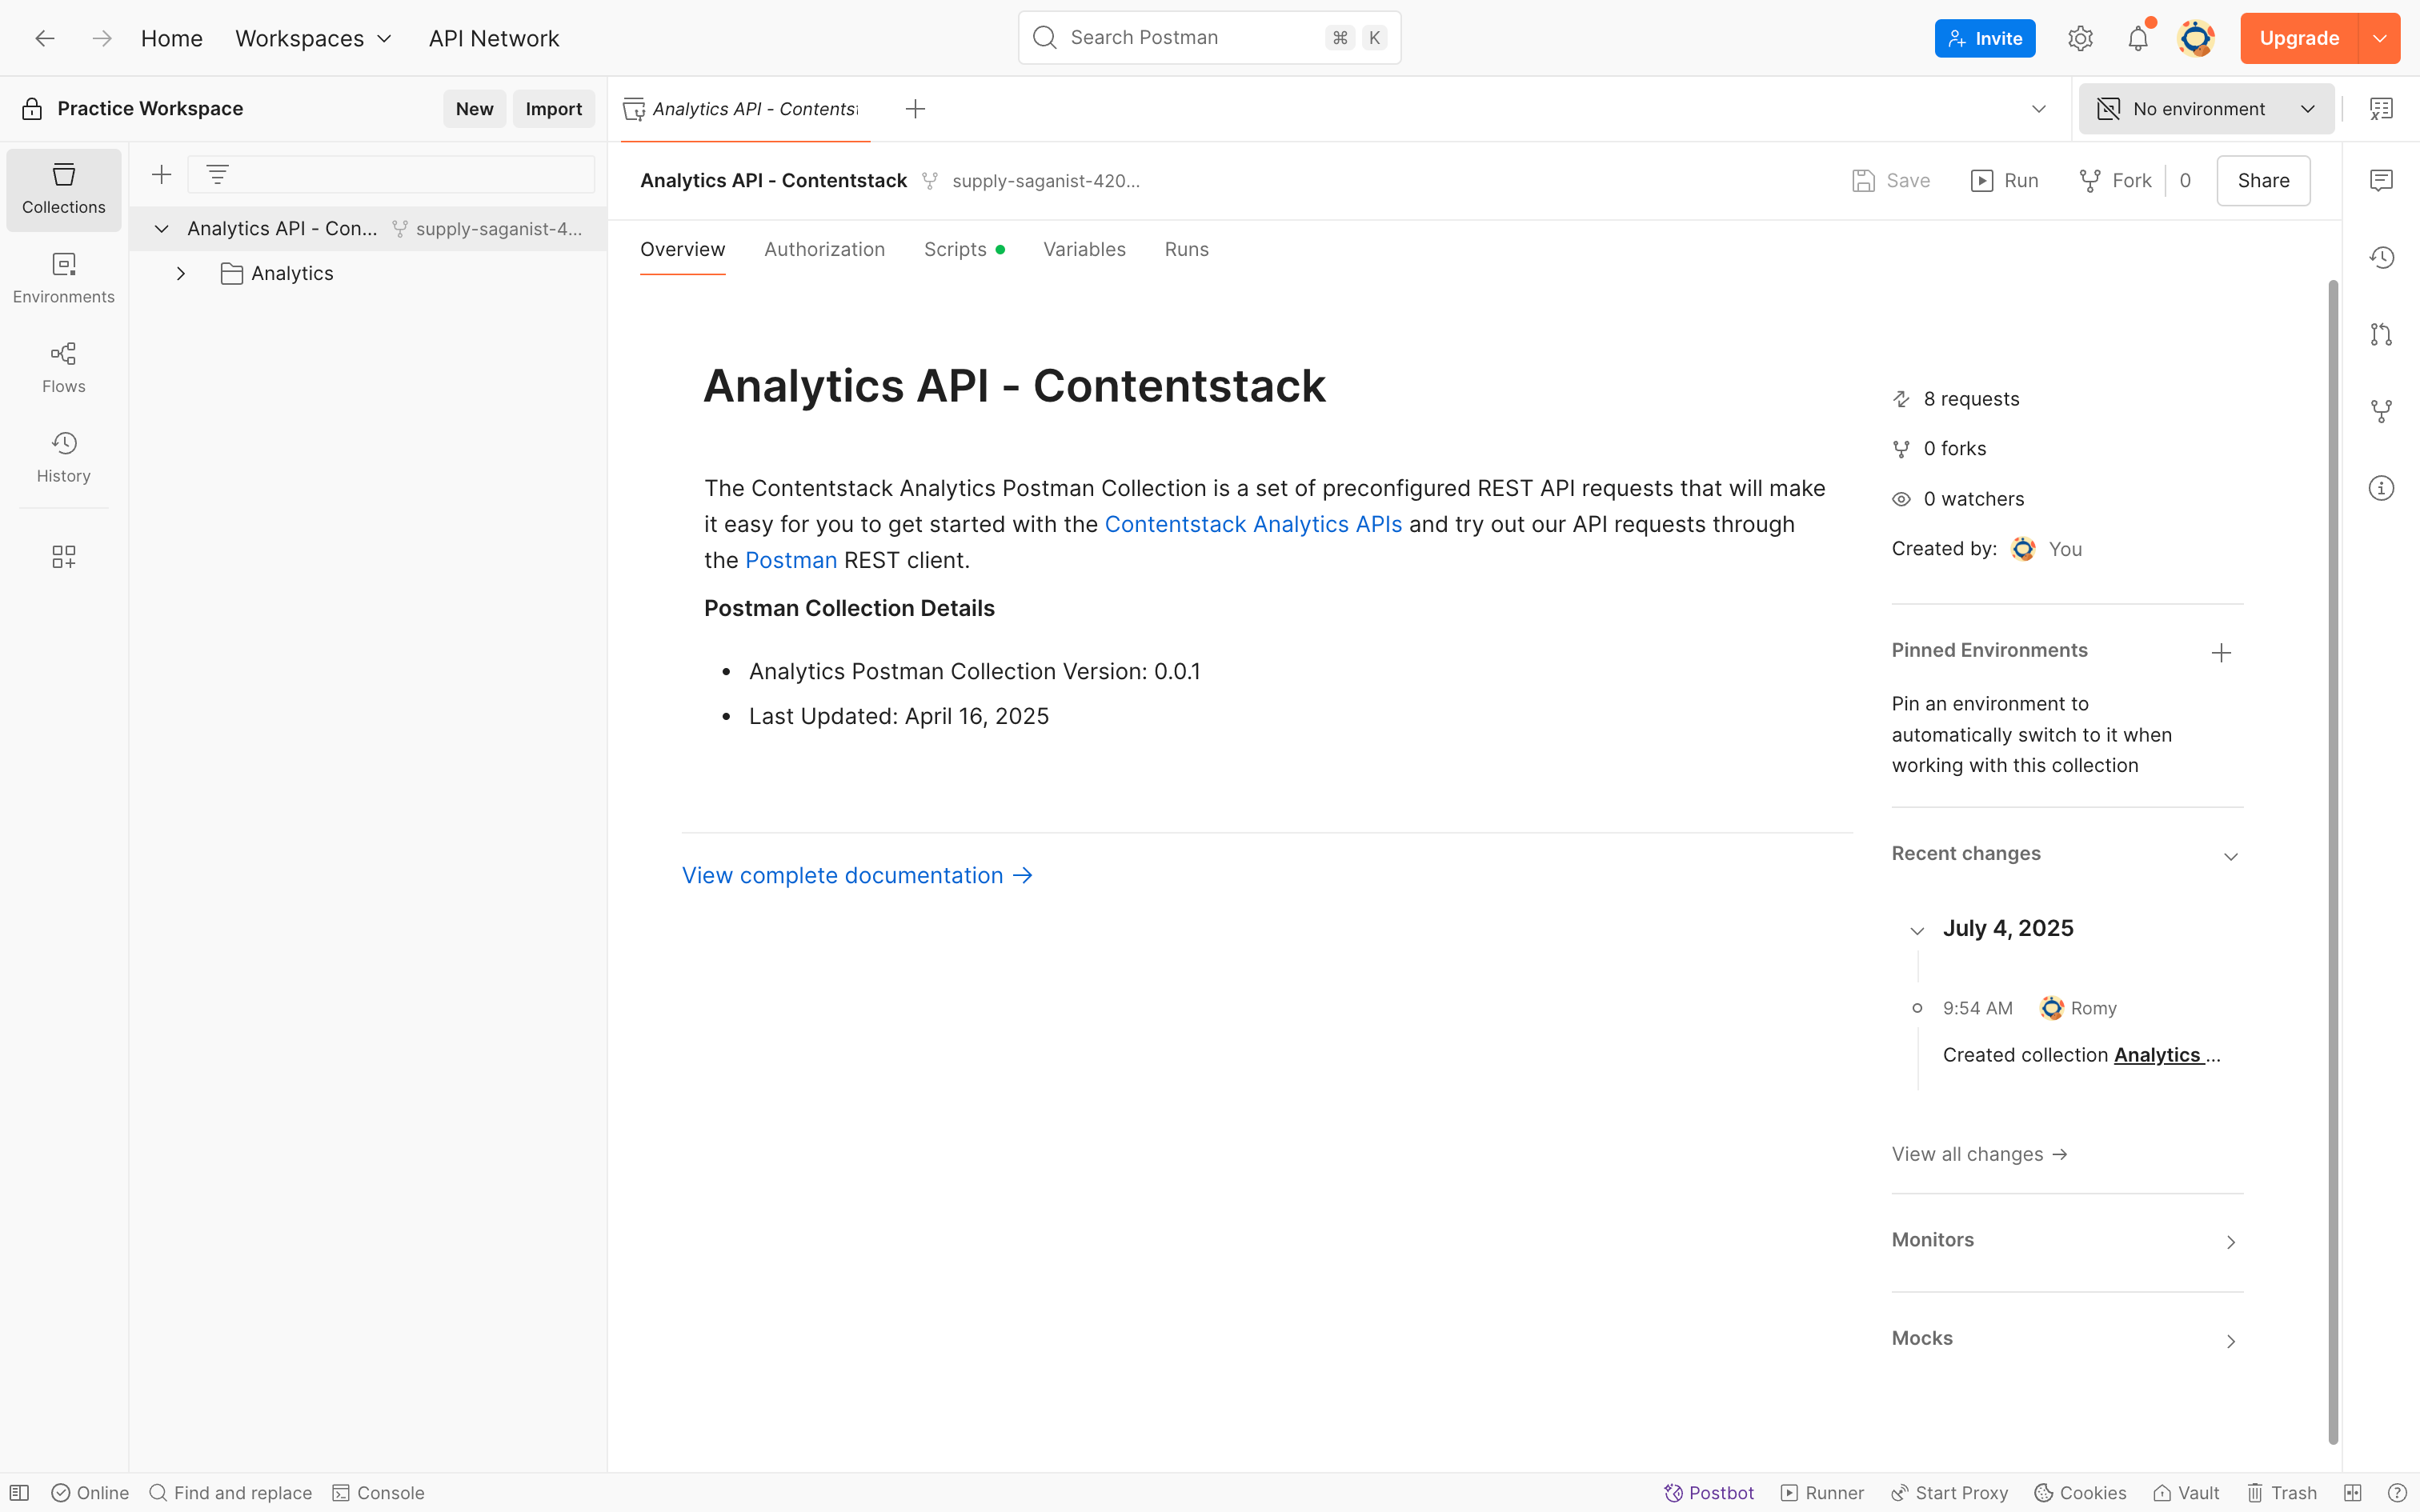
Note: If you want to try out the API requests, you can either import a copy of the collection or fork the collection.
Import a Copy of the Collection
This option allows you to import a copy of the collection into your workspace.
To import the Analytics API collection, perform the following steps:
- Click the import a copy link in the Fork collection into your workspace modal.
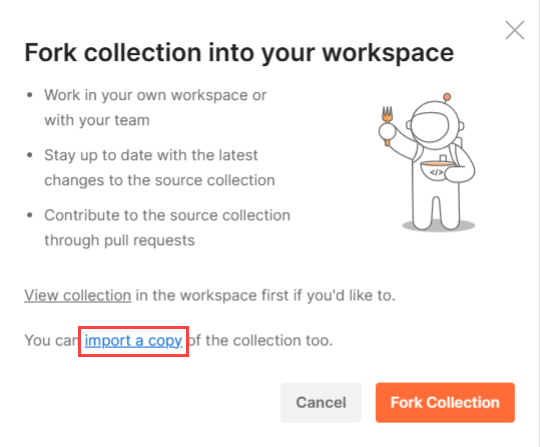
- In the resulting Import Collection modal within the Postman app, select a workspace and click Import to import the latest Postman collection into your selected workspace.
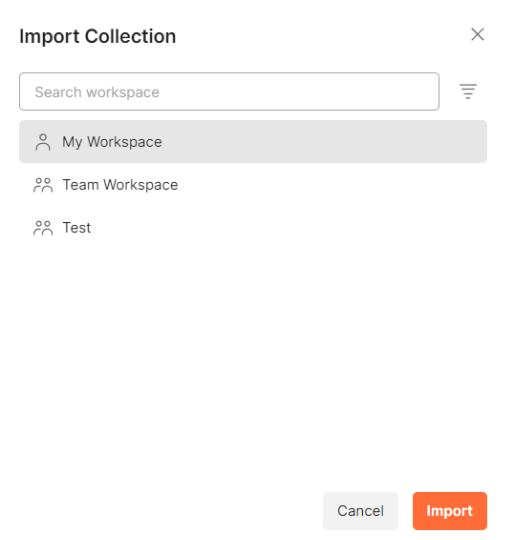
You will see a copy of the latest Postman collection in the left navigation panel.
Fork the Collection
This option allows you to fork, or create a copy of the collection, and perform changes to the collection without affecting the original.
To fork the Analytics API collection, perform the following steps:
- Click the Fork Collection button in the Fork collection into your workspace modal.
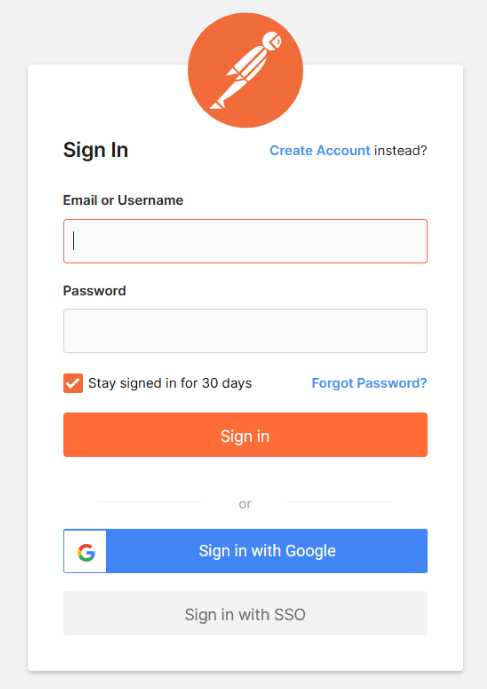
- This opens the Sign In page. You can either enter your login credentials and click Sign in, or sign in using your Google account or via SSO.
- In the resulting Fork collection modal, if needed, enter a Fork label that lets you uniquely identify your collection and select a Workspace.
- Under Notifications, check Watch original collection to get notified of any changes that are made to the original collection.
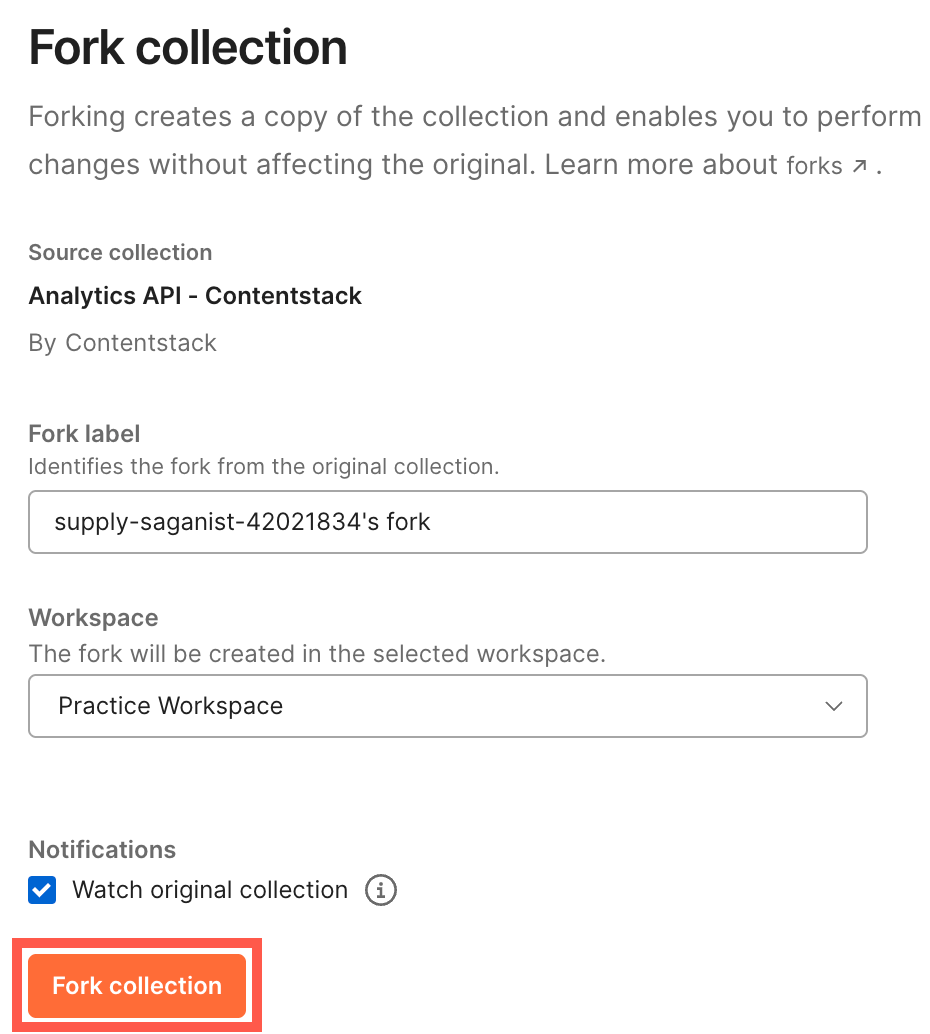
- Once done, click Fork collection to fork the Postman collection into your selected workspace.
Download Collection from GitHub Page
We have also hosted our Postman collection on GitHub. You can follow the steps mentioned in the Readme file to download and start using it.
You can also choose to watch the latest Postman collection to get notifications of new releases or updates.
To do so, click the following Watch button and select Watching.
Configure Environment Variables
When you download and install the latest version of the Analytics API Postman Collection, you also download and import the respective environment along with the environment variables.
Once your environment is imported, next you need to set your environment specific values.
Note: As these environment variables are referenced across multiple API requests, once you set the variables, it becomes a lot more convenient to make repeated use of the Postman Collection.
Some of the important variables that you need to set are as follows:
| Environment Variable | Value |
|---|---|
| base_url | app.contentstack.com |
| organization_uid | your_organization_uid |
| authtoken | your_authtoken |
Note: The Postman Collection will require a valid Authtoken to make API calls. Check out the Authentication section for more details.
If you want to add your own environment variables, you can follow the procedure in the next section.
Add Other Environment Variables
To add any new environment variables for your Postman collection, perform the following steps:
- Identify the environment variables that you want to define.
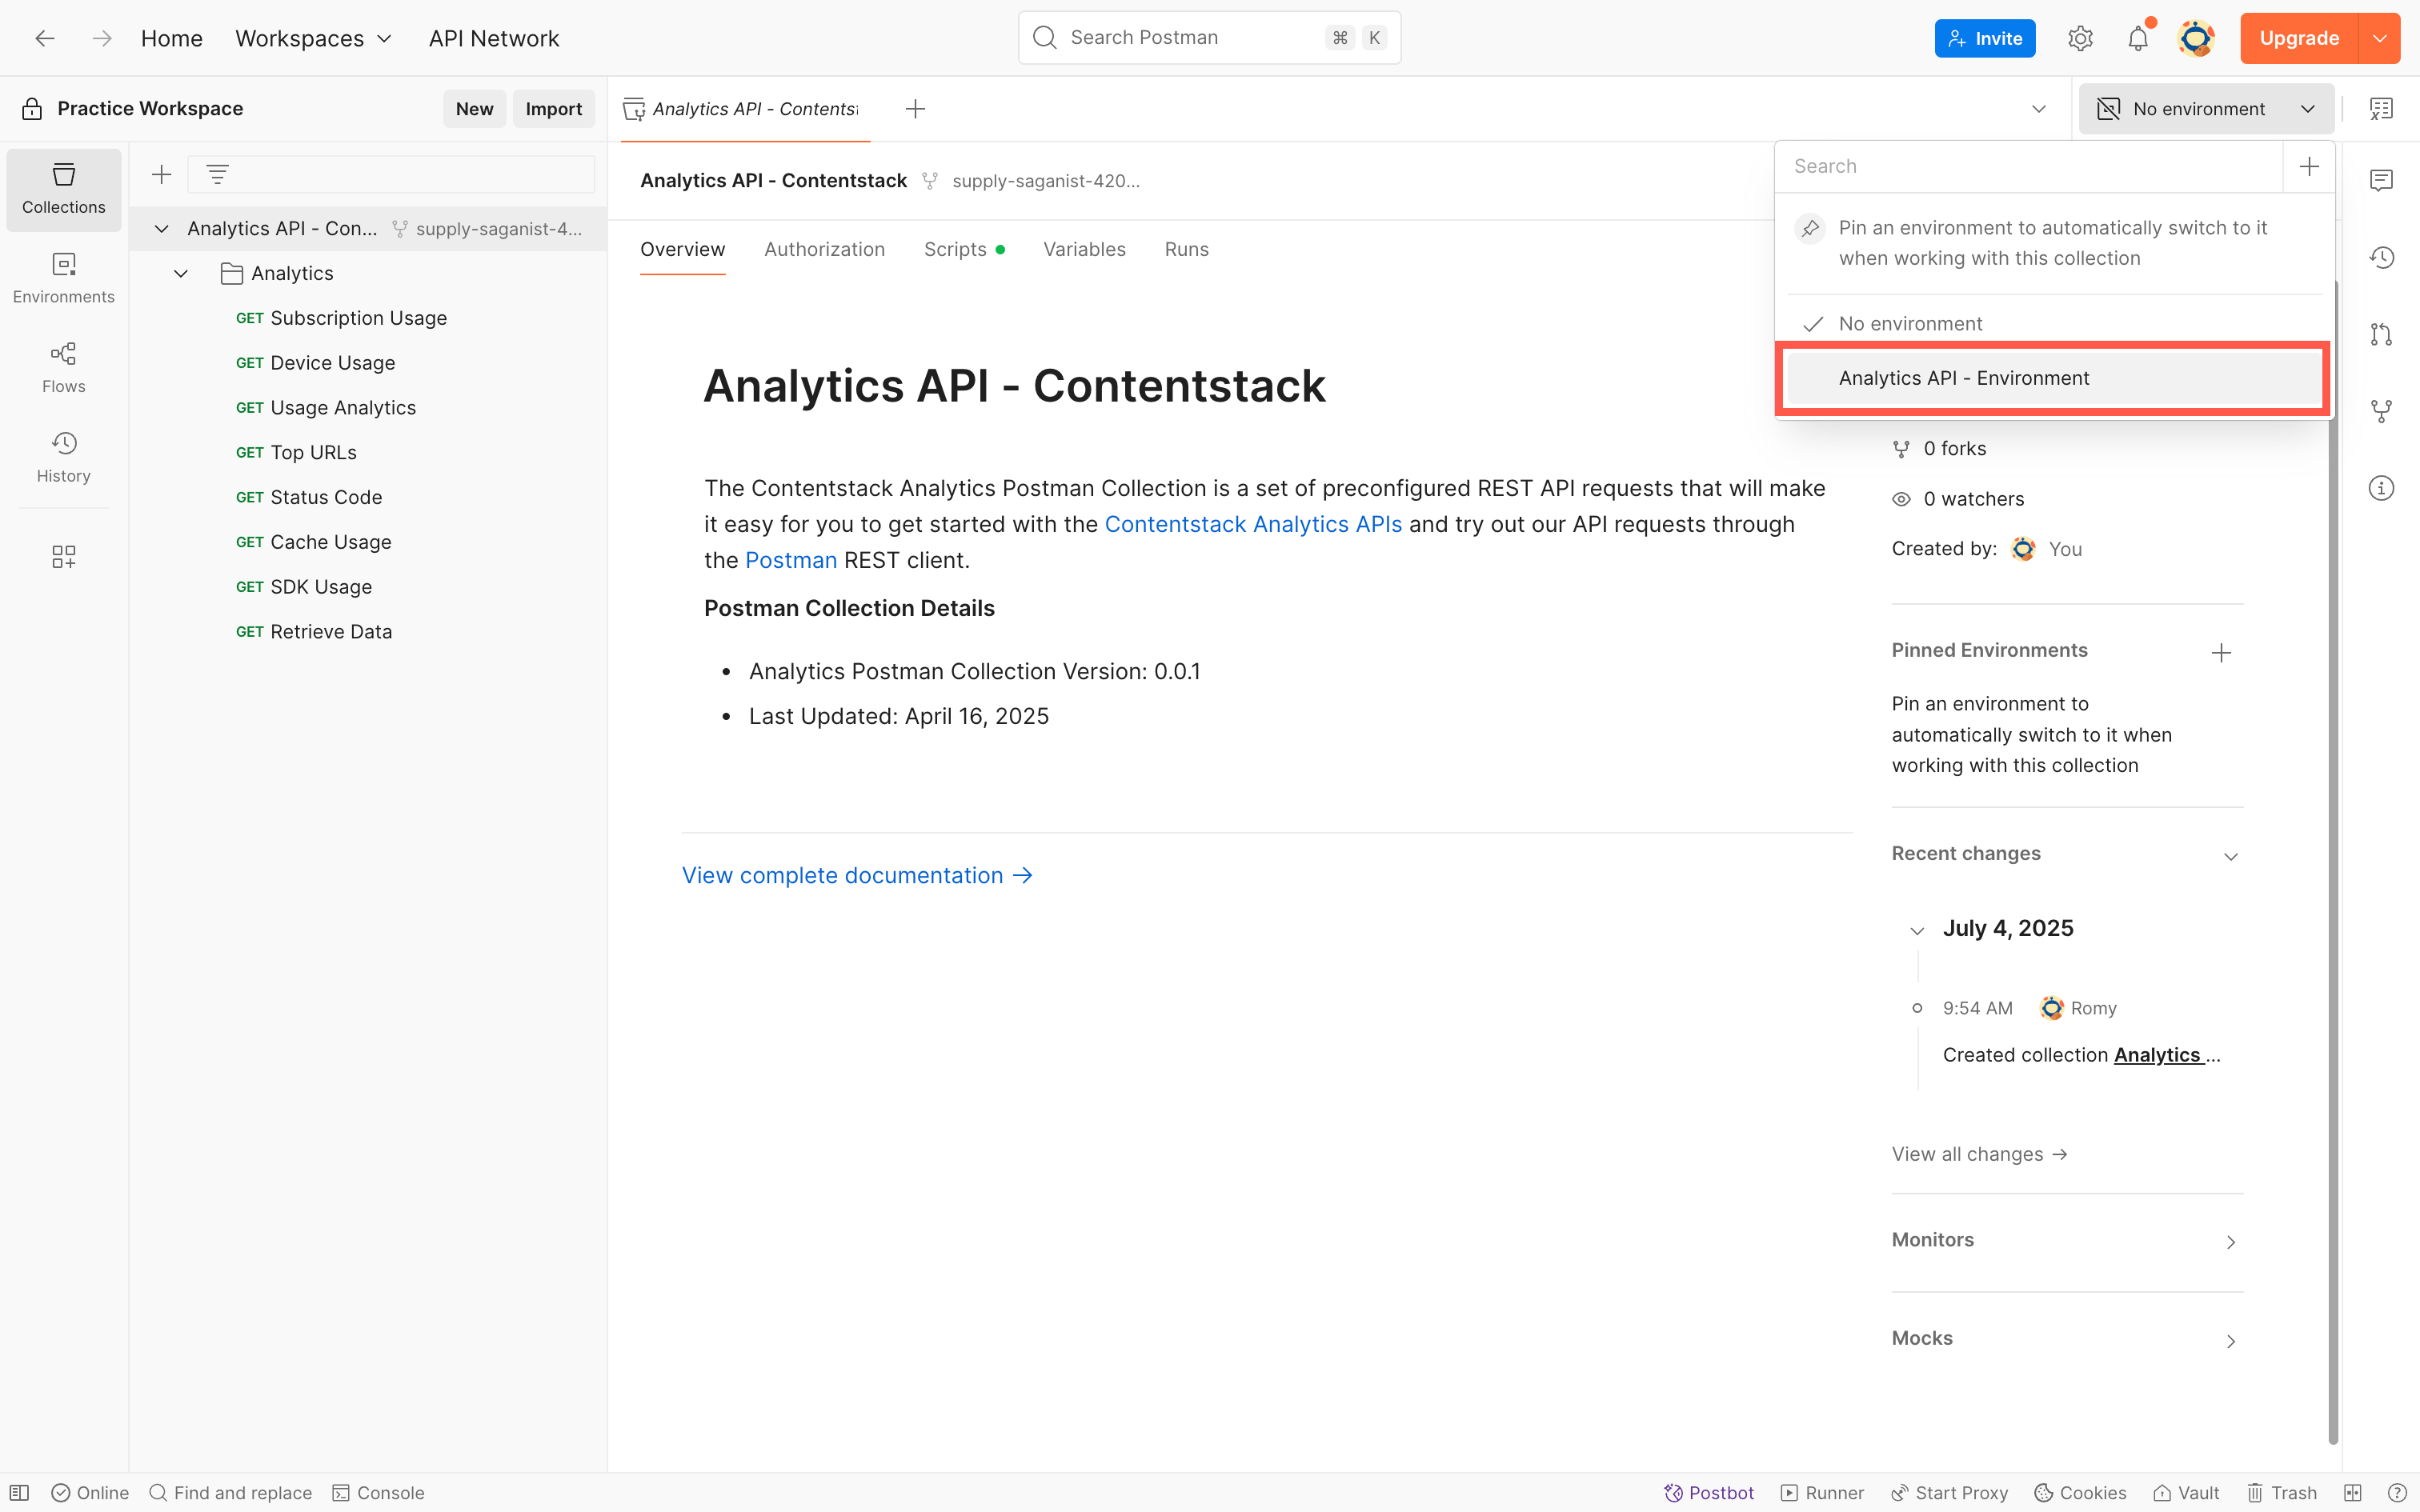
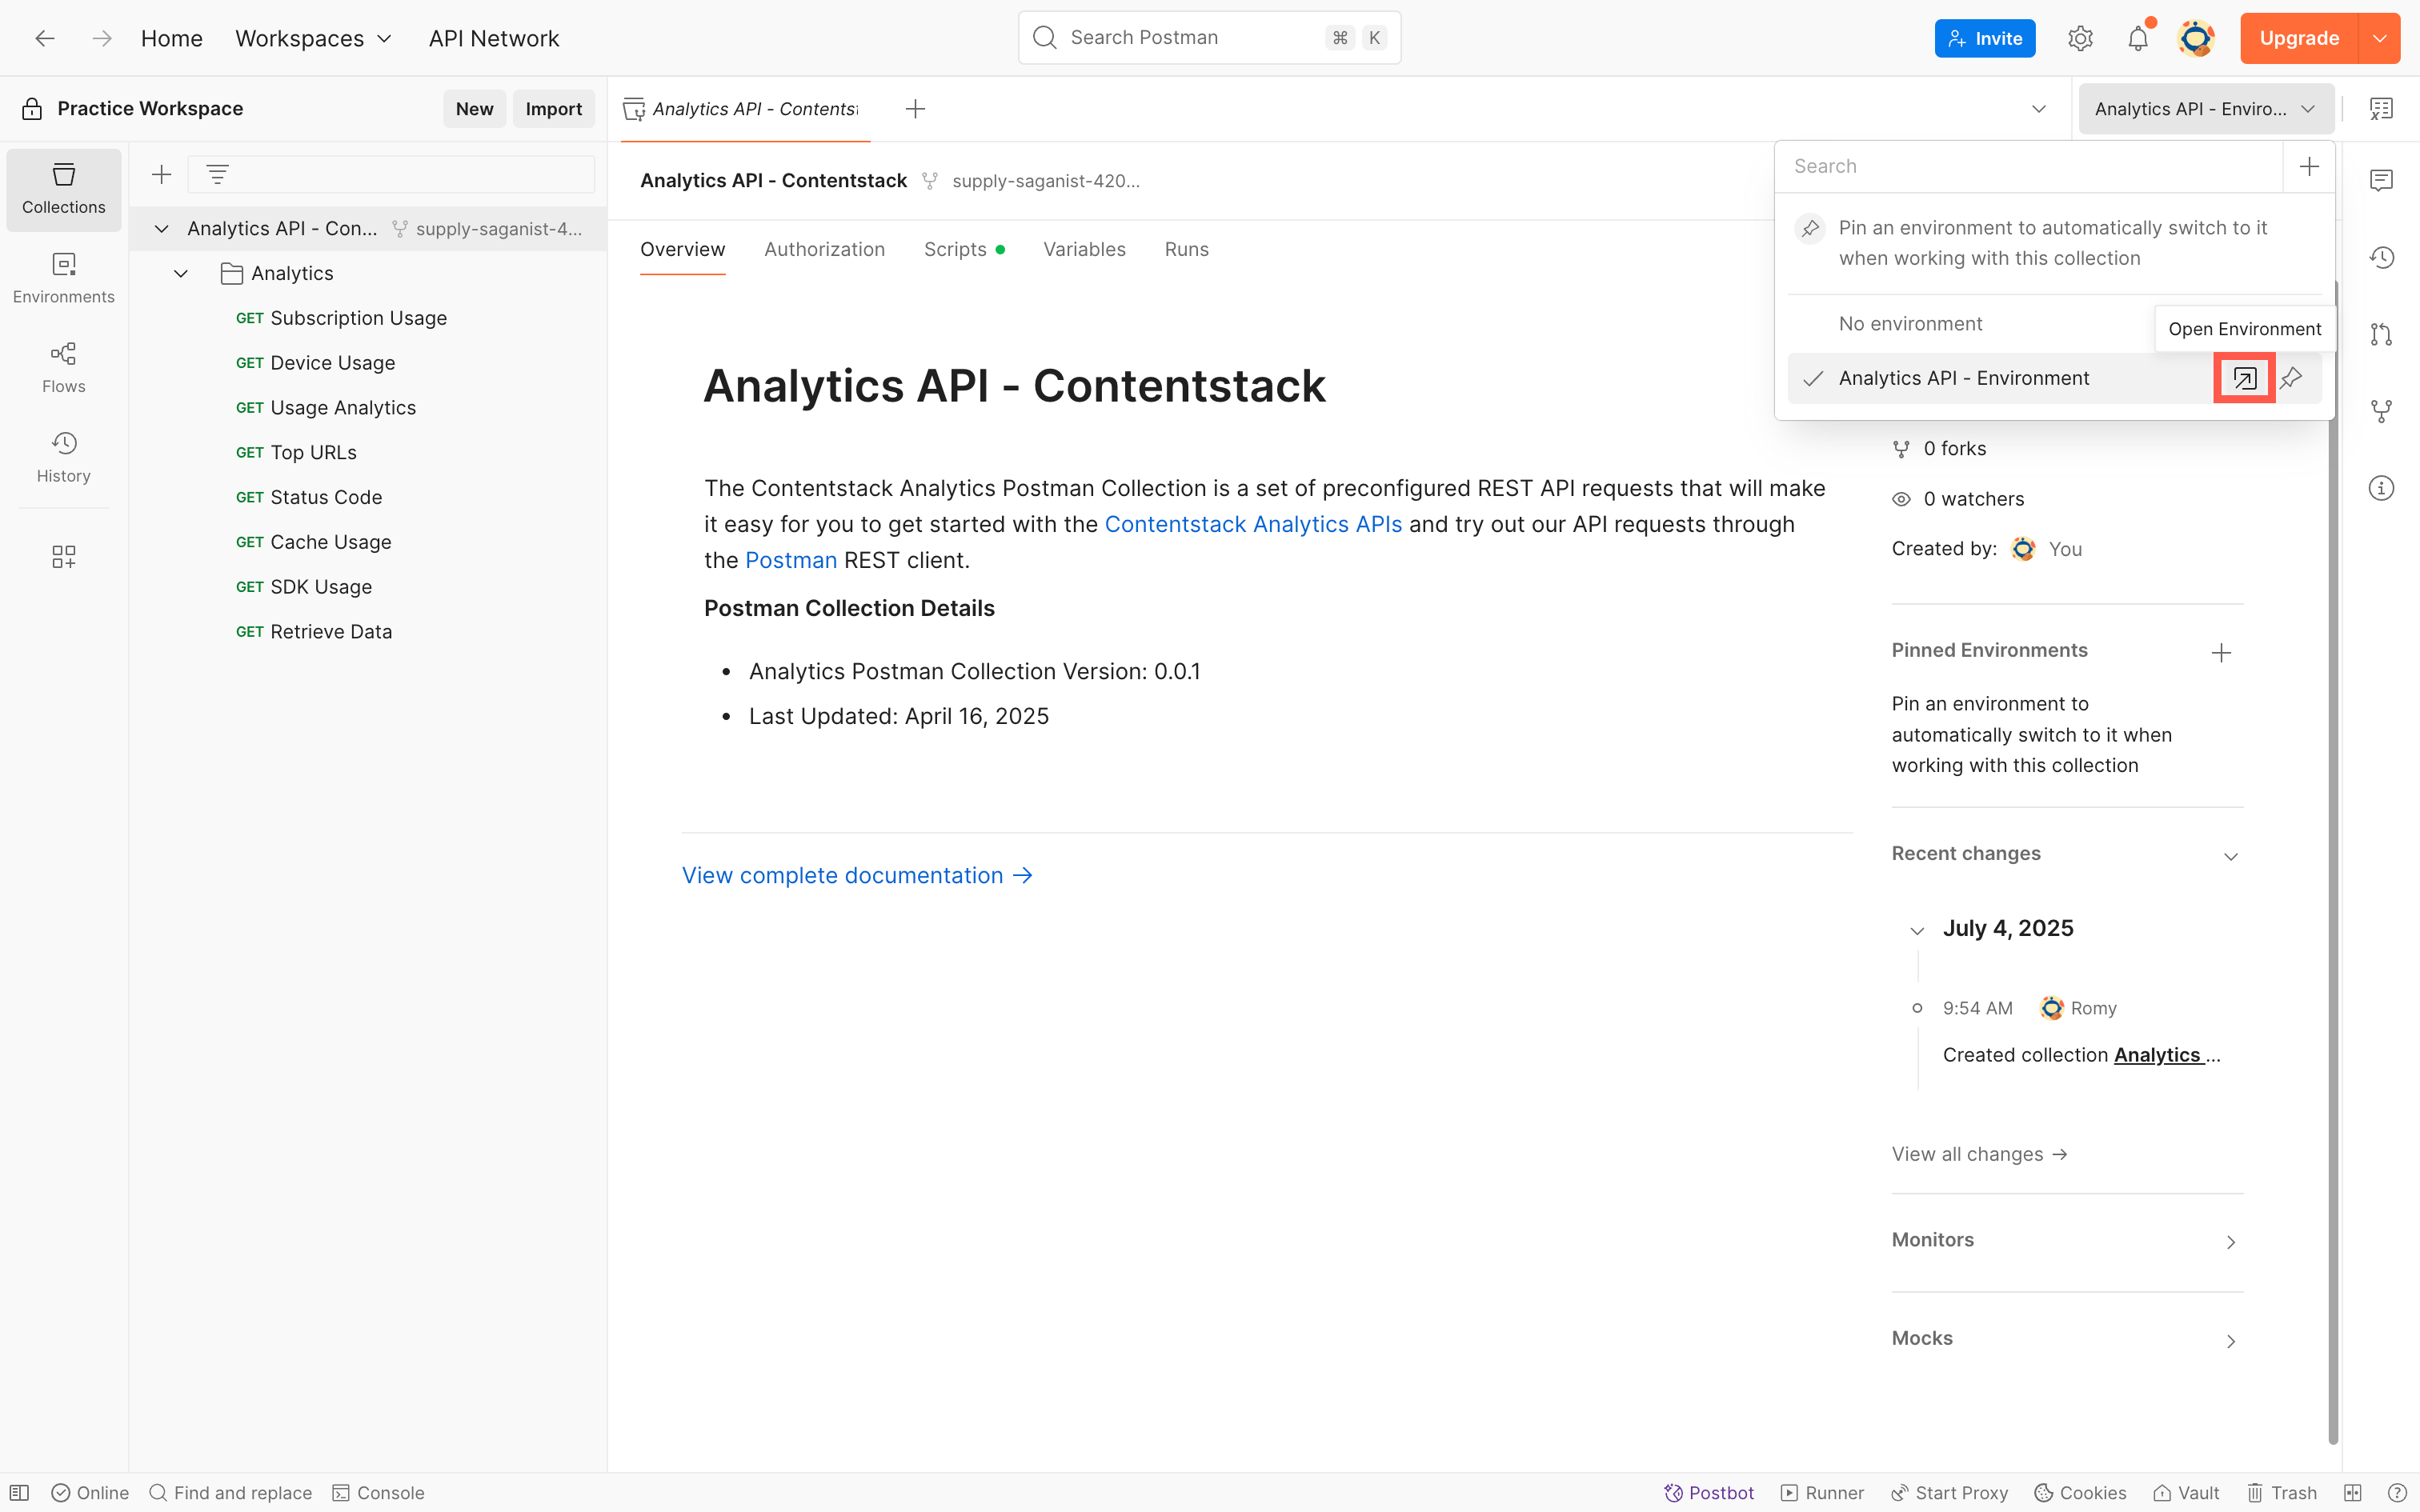
- In the top right corner of Postman, click on the environment's dropdown and select Analytics API - Environment.
- Click the "Open Environment" icon present in the top right corner of Postman. It opens up in the environment variables window.
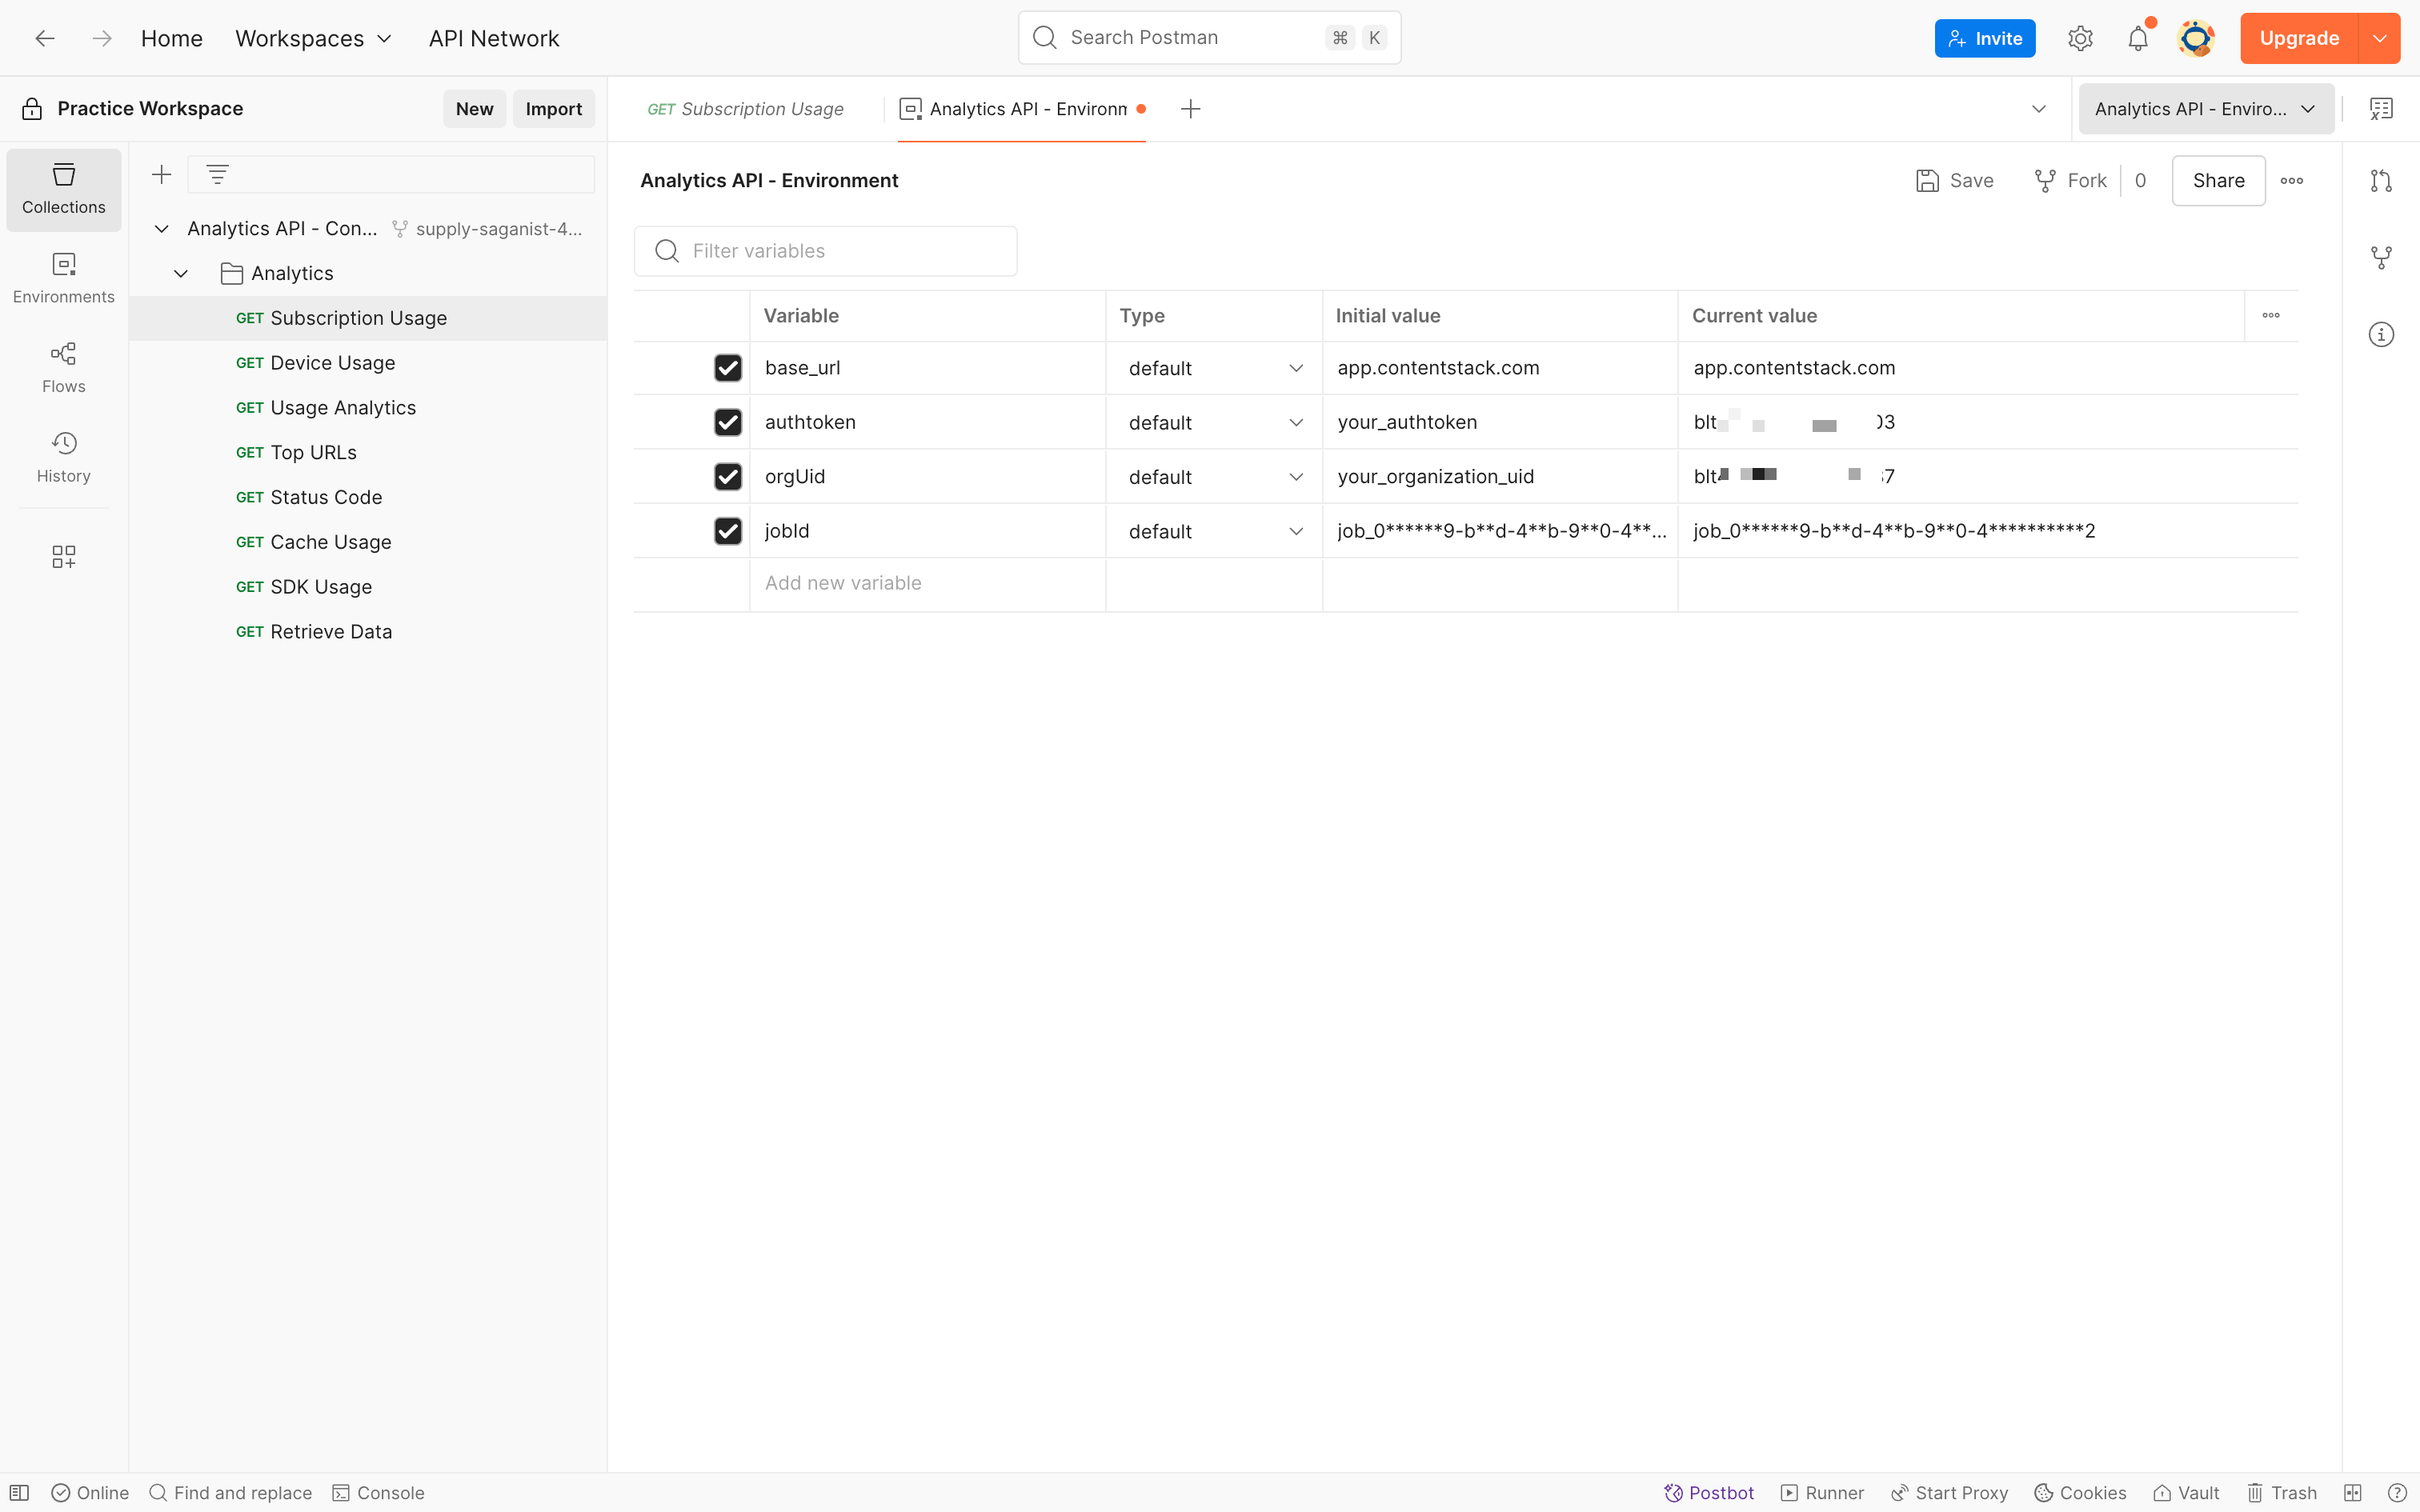
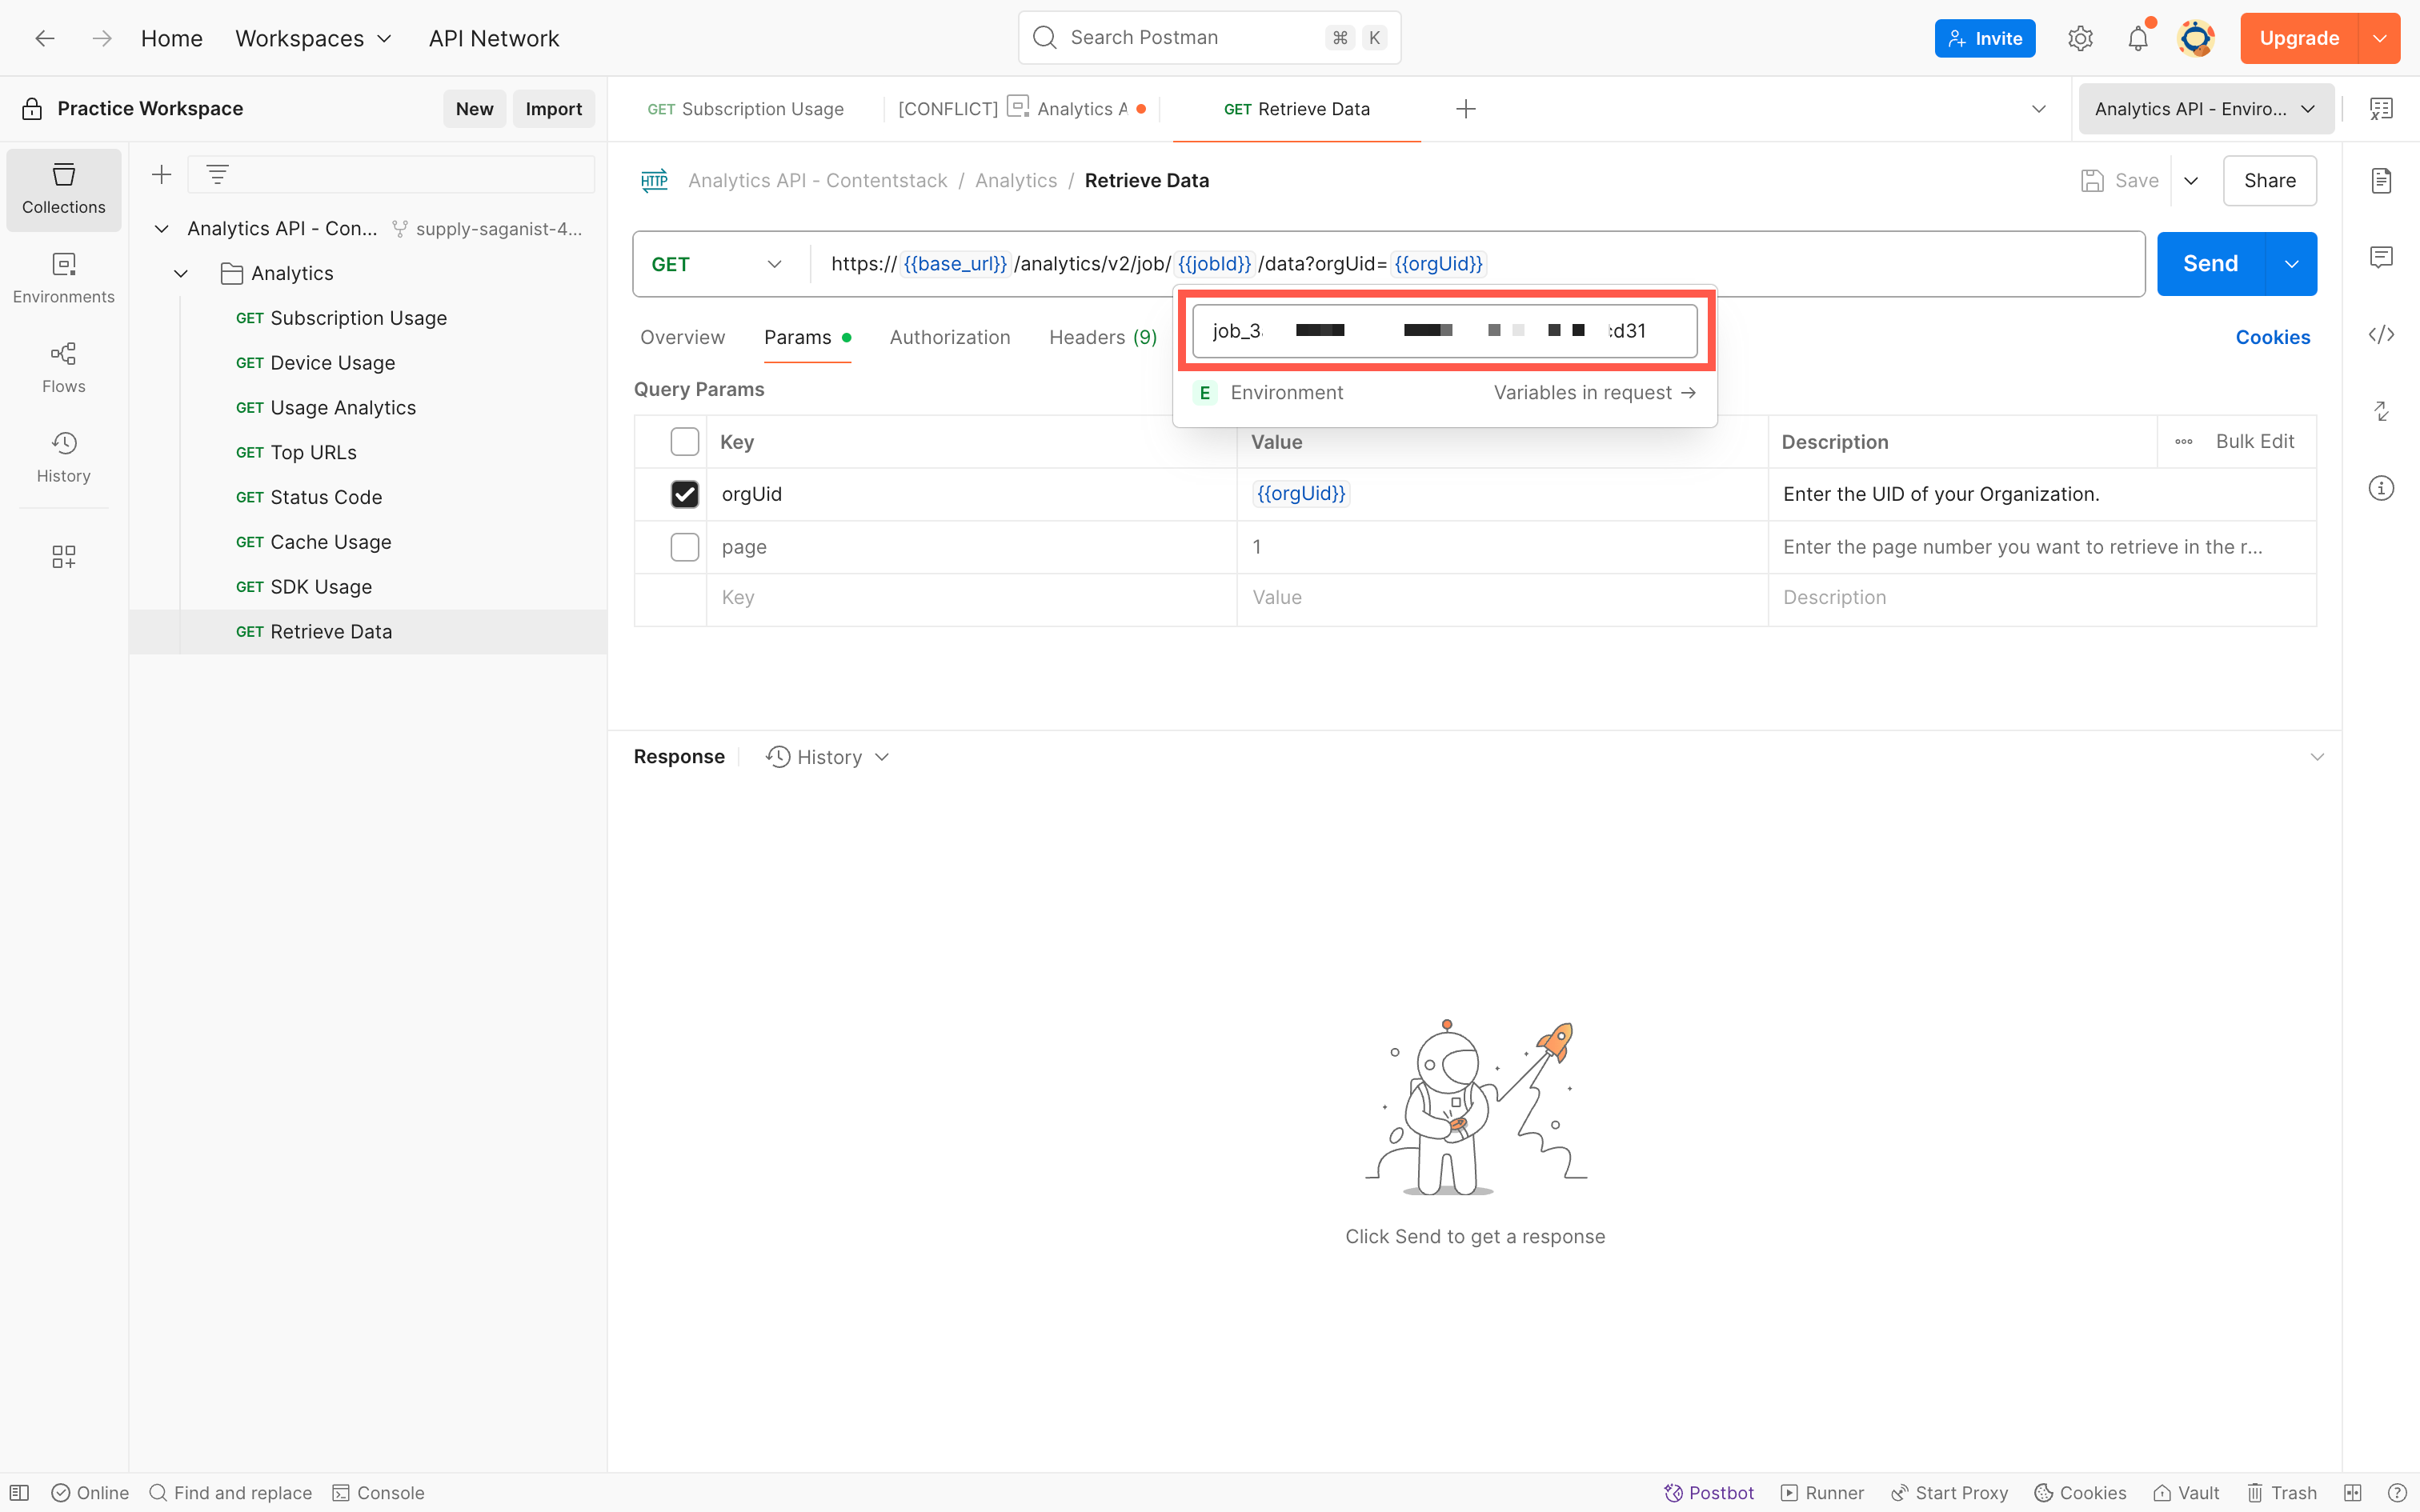
- In the Variable field, enter the name of the environment variables required to run the Analytics API, that is, base_url, authtoken, orgUid, and jobId (to retrieve the actual response). In the Current value field, enter your account-specific value that will replace the variable when the call is made.
- Once you have defined your variables, click Save.
Update Environment Variables
With every new API request added, we update our environment file. So, to get the latest environment variables, you need to download the collection along with the updated environment file again, compare your existing environment with the latest environment, identify and add the new variables to your existing environment.
Next, let’s see how you can run API Requests from your Automate Postman collection using your environment.
Make an API Request
With the Automate Postman Collection loaded into the Postman app (on the left panel) and the environment created, you can now make API requests to the Automate API via Postman.
To make an API request, perform the following steps:
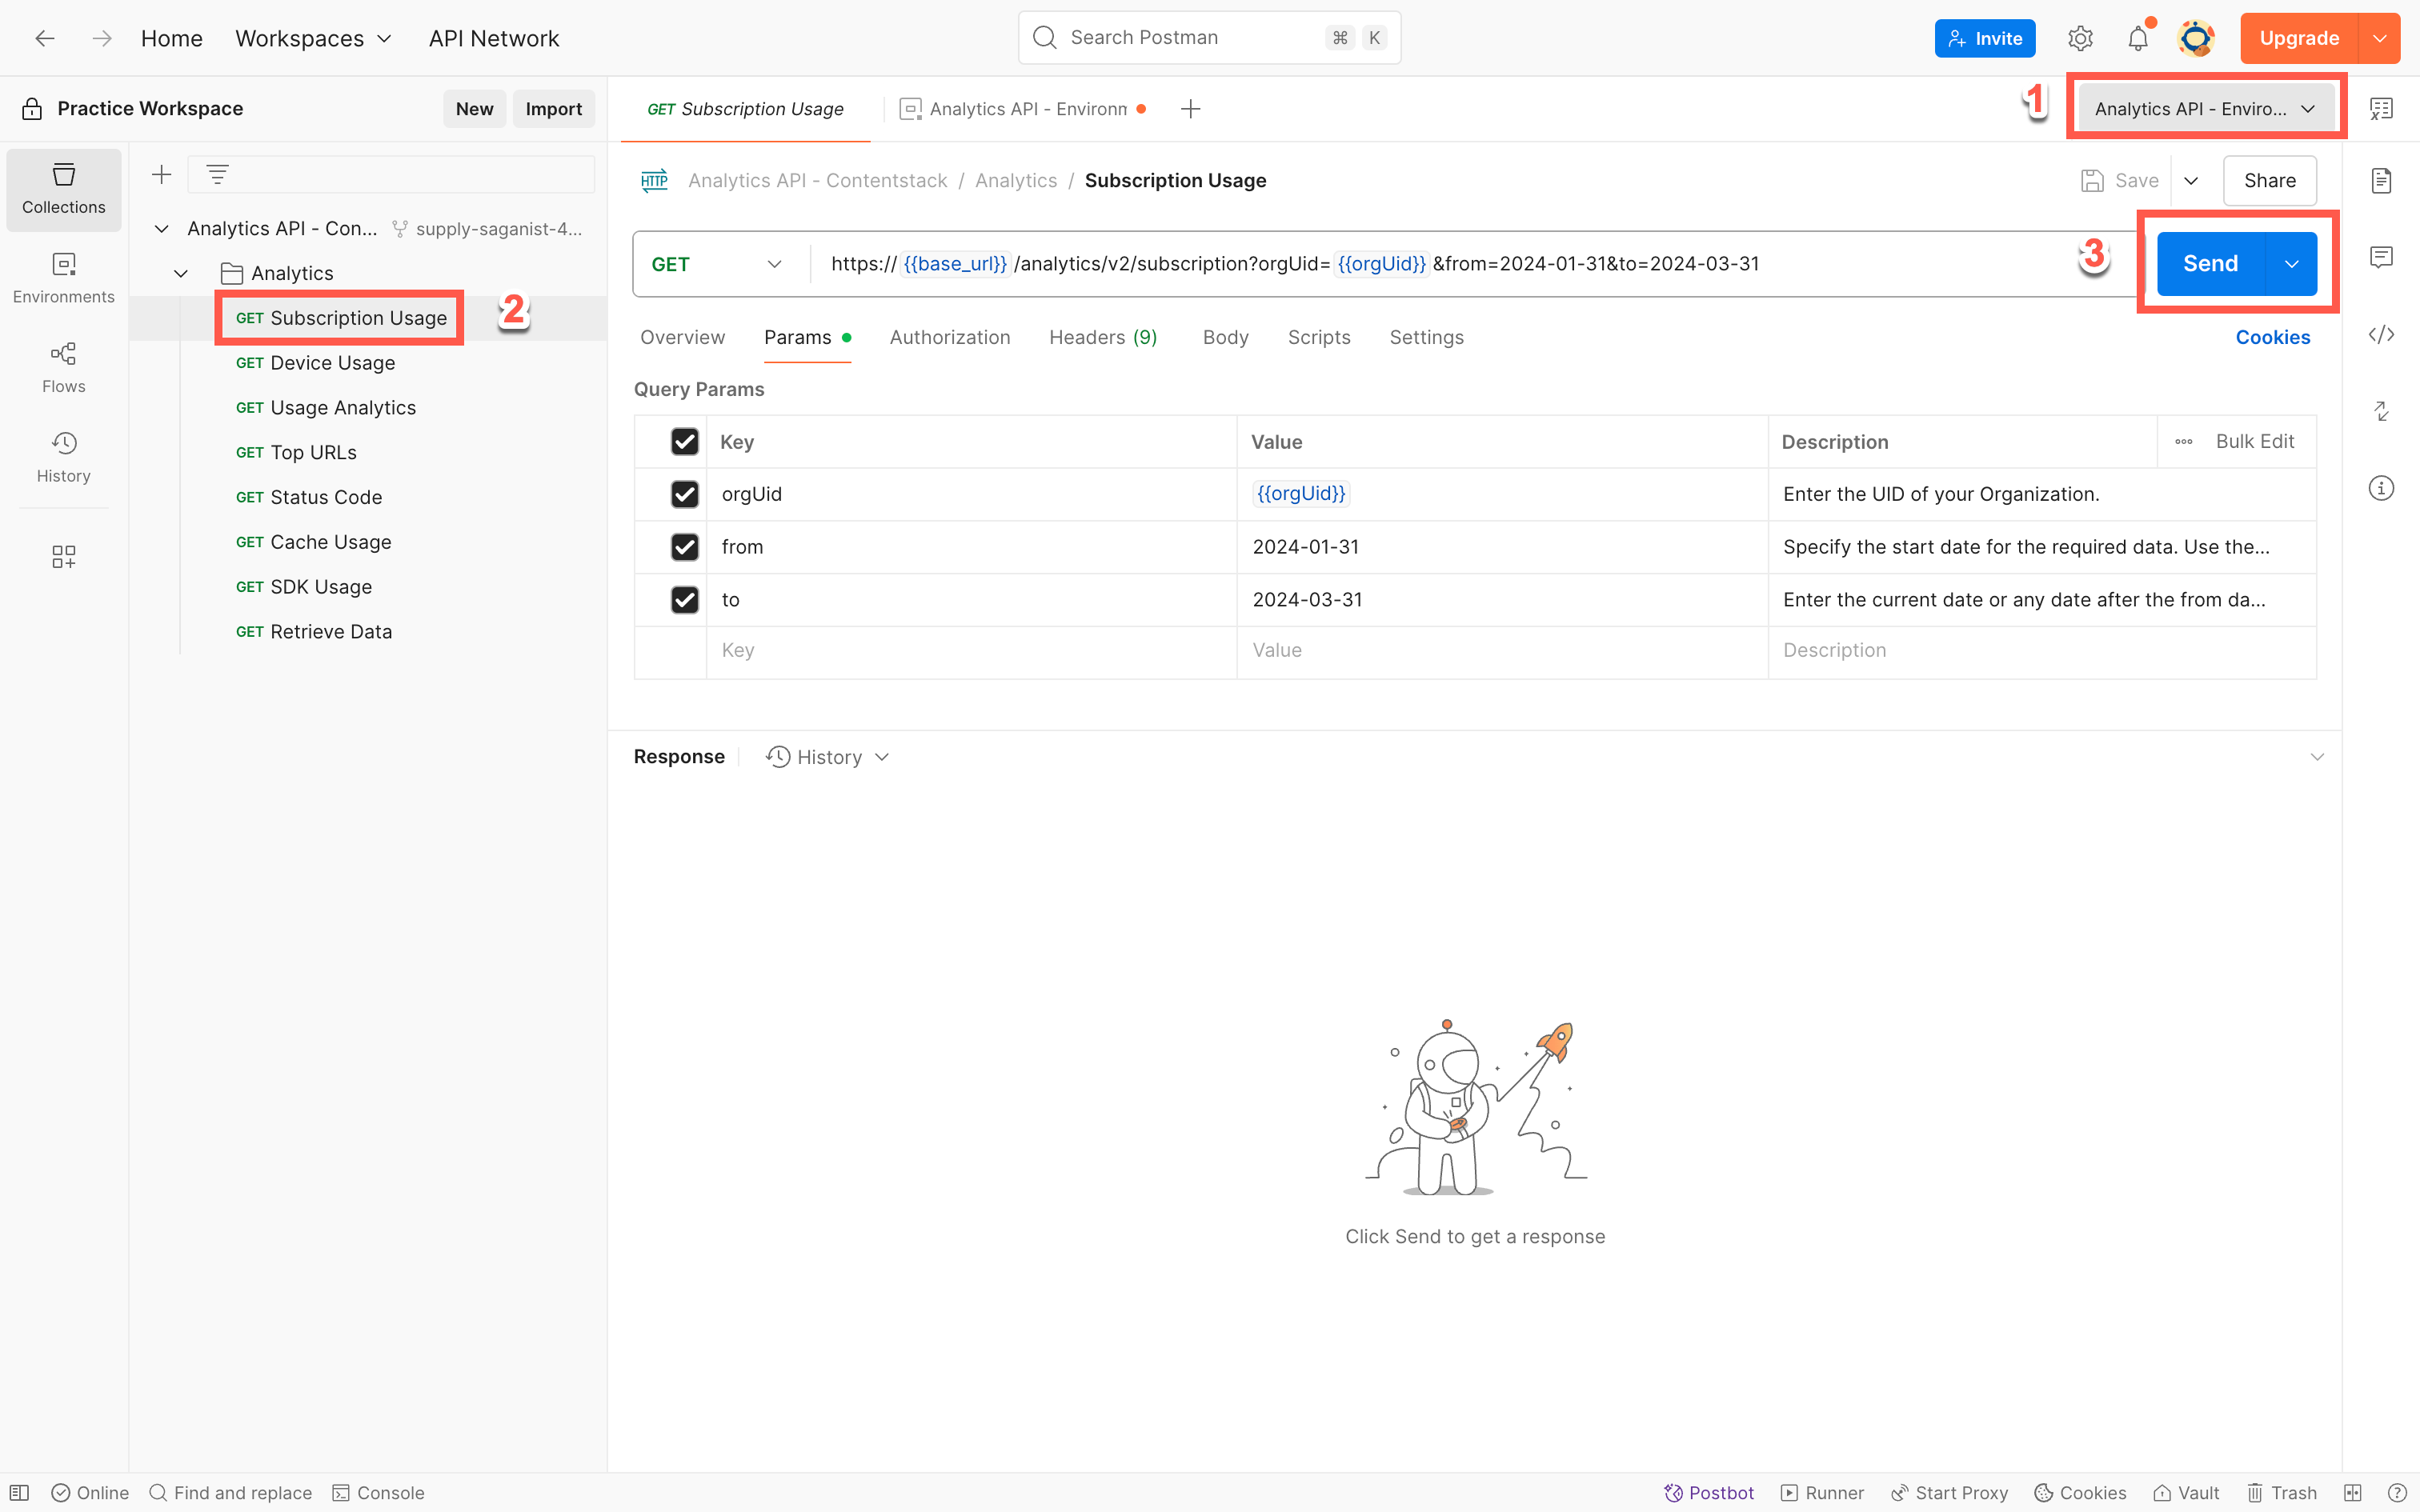
- Select the respective environment, Analytics API - Environment, from the dropdown.
- Select an API request from the Analytics Postman Collection. In this example, we will use the Subscription Usage request.
Note: If you want to make changes to your parameters or want to add parameters of your own, you can do it here.
- Next, click Send at the top right to make the API request.
 The API call should return a jobId in the response under the Body tab in the bottom half of the screen.
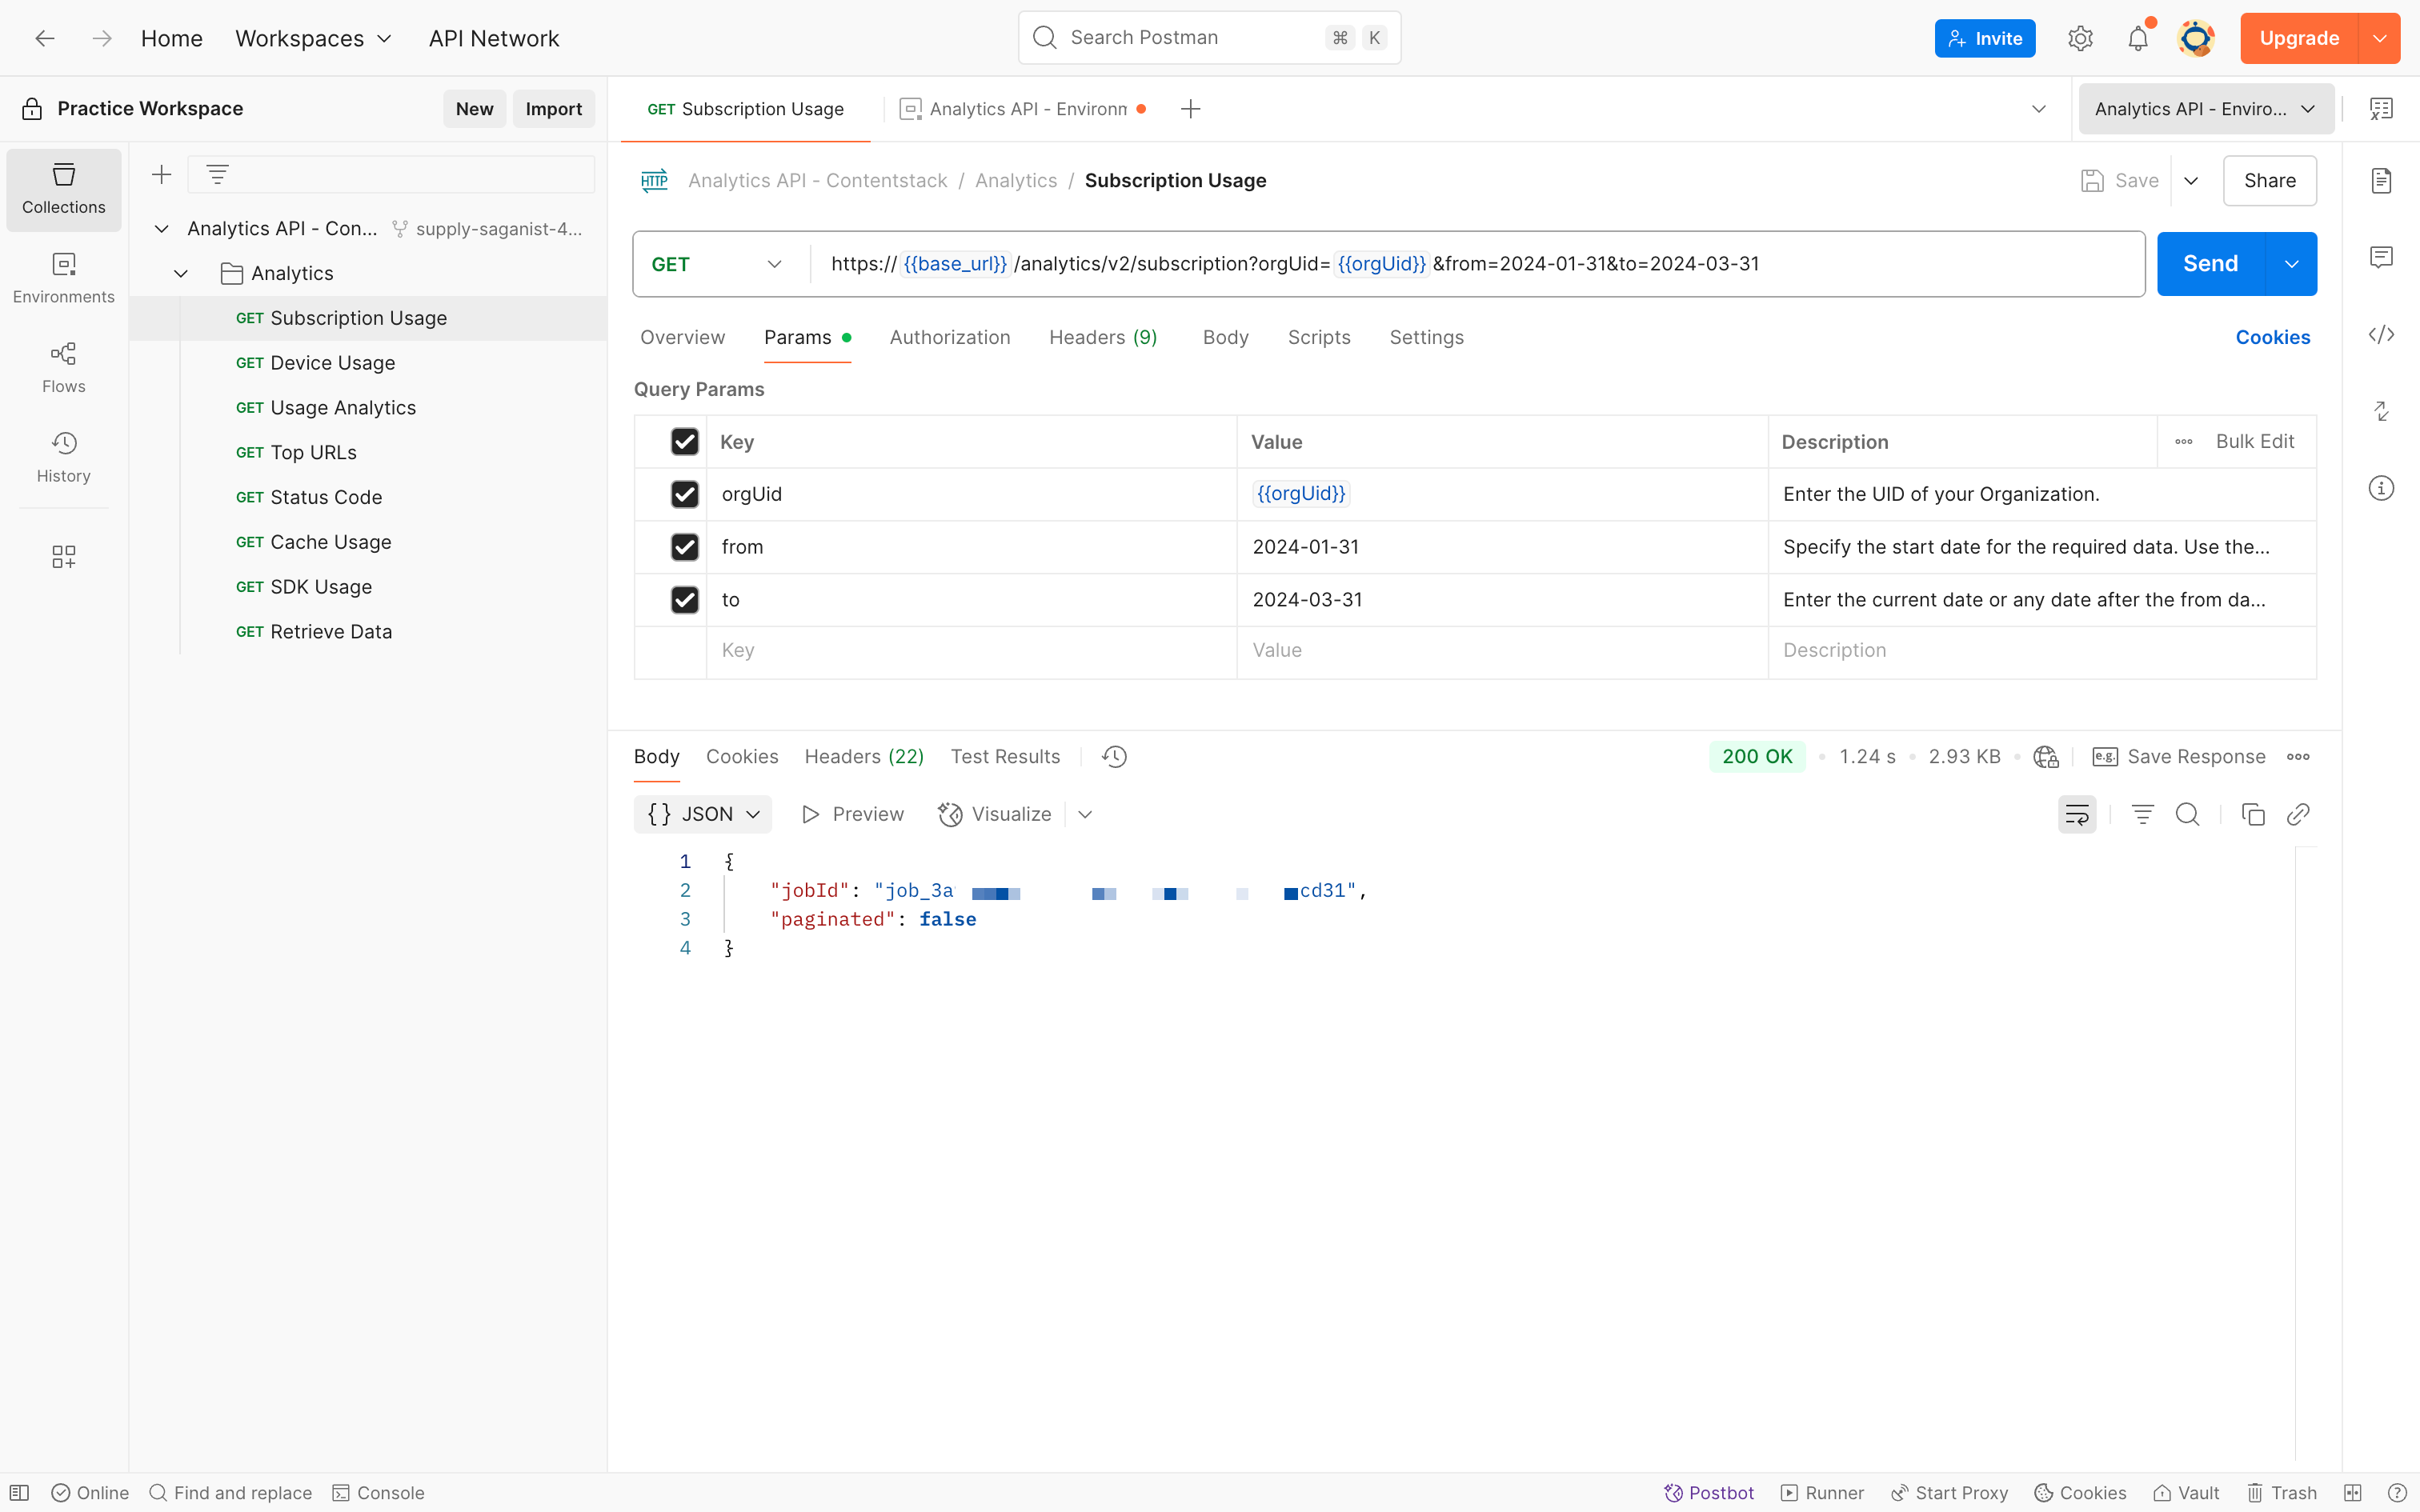
- Copy the jobId received in the response of your request and pass it as a URL parameter in the Retrieve Data API request to retrieve the actual response.
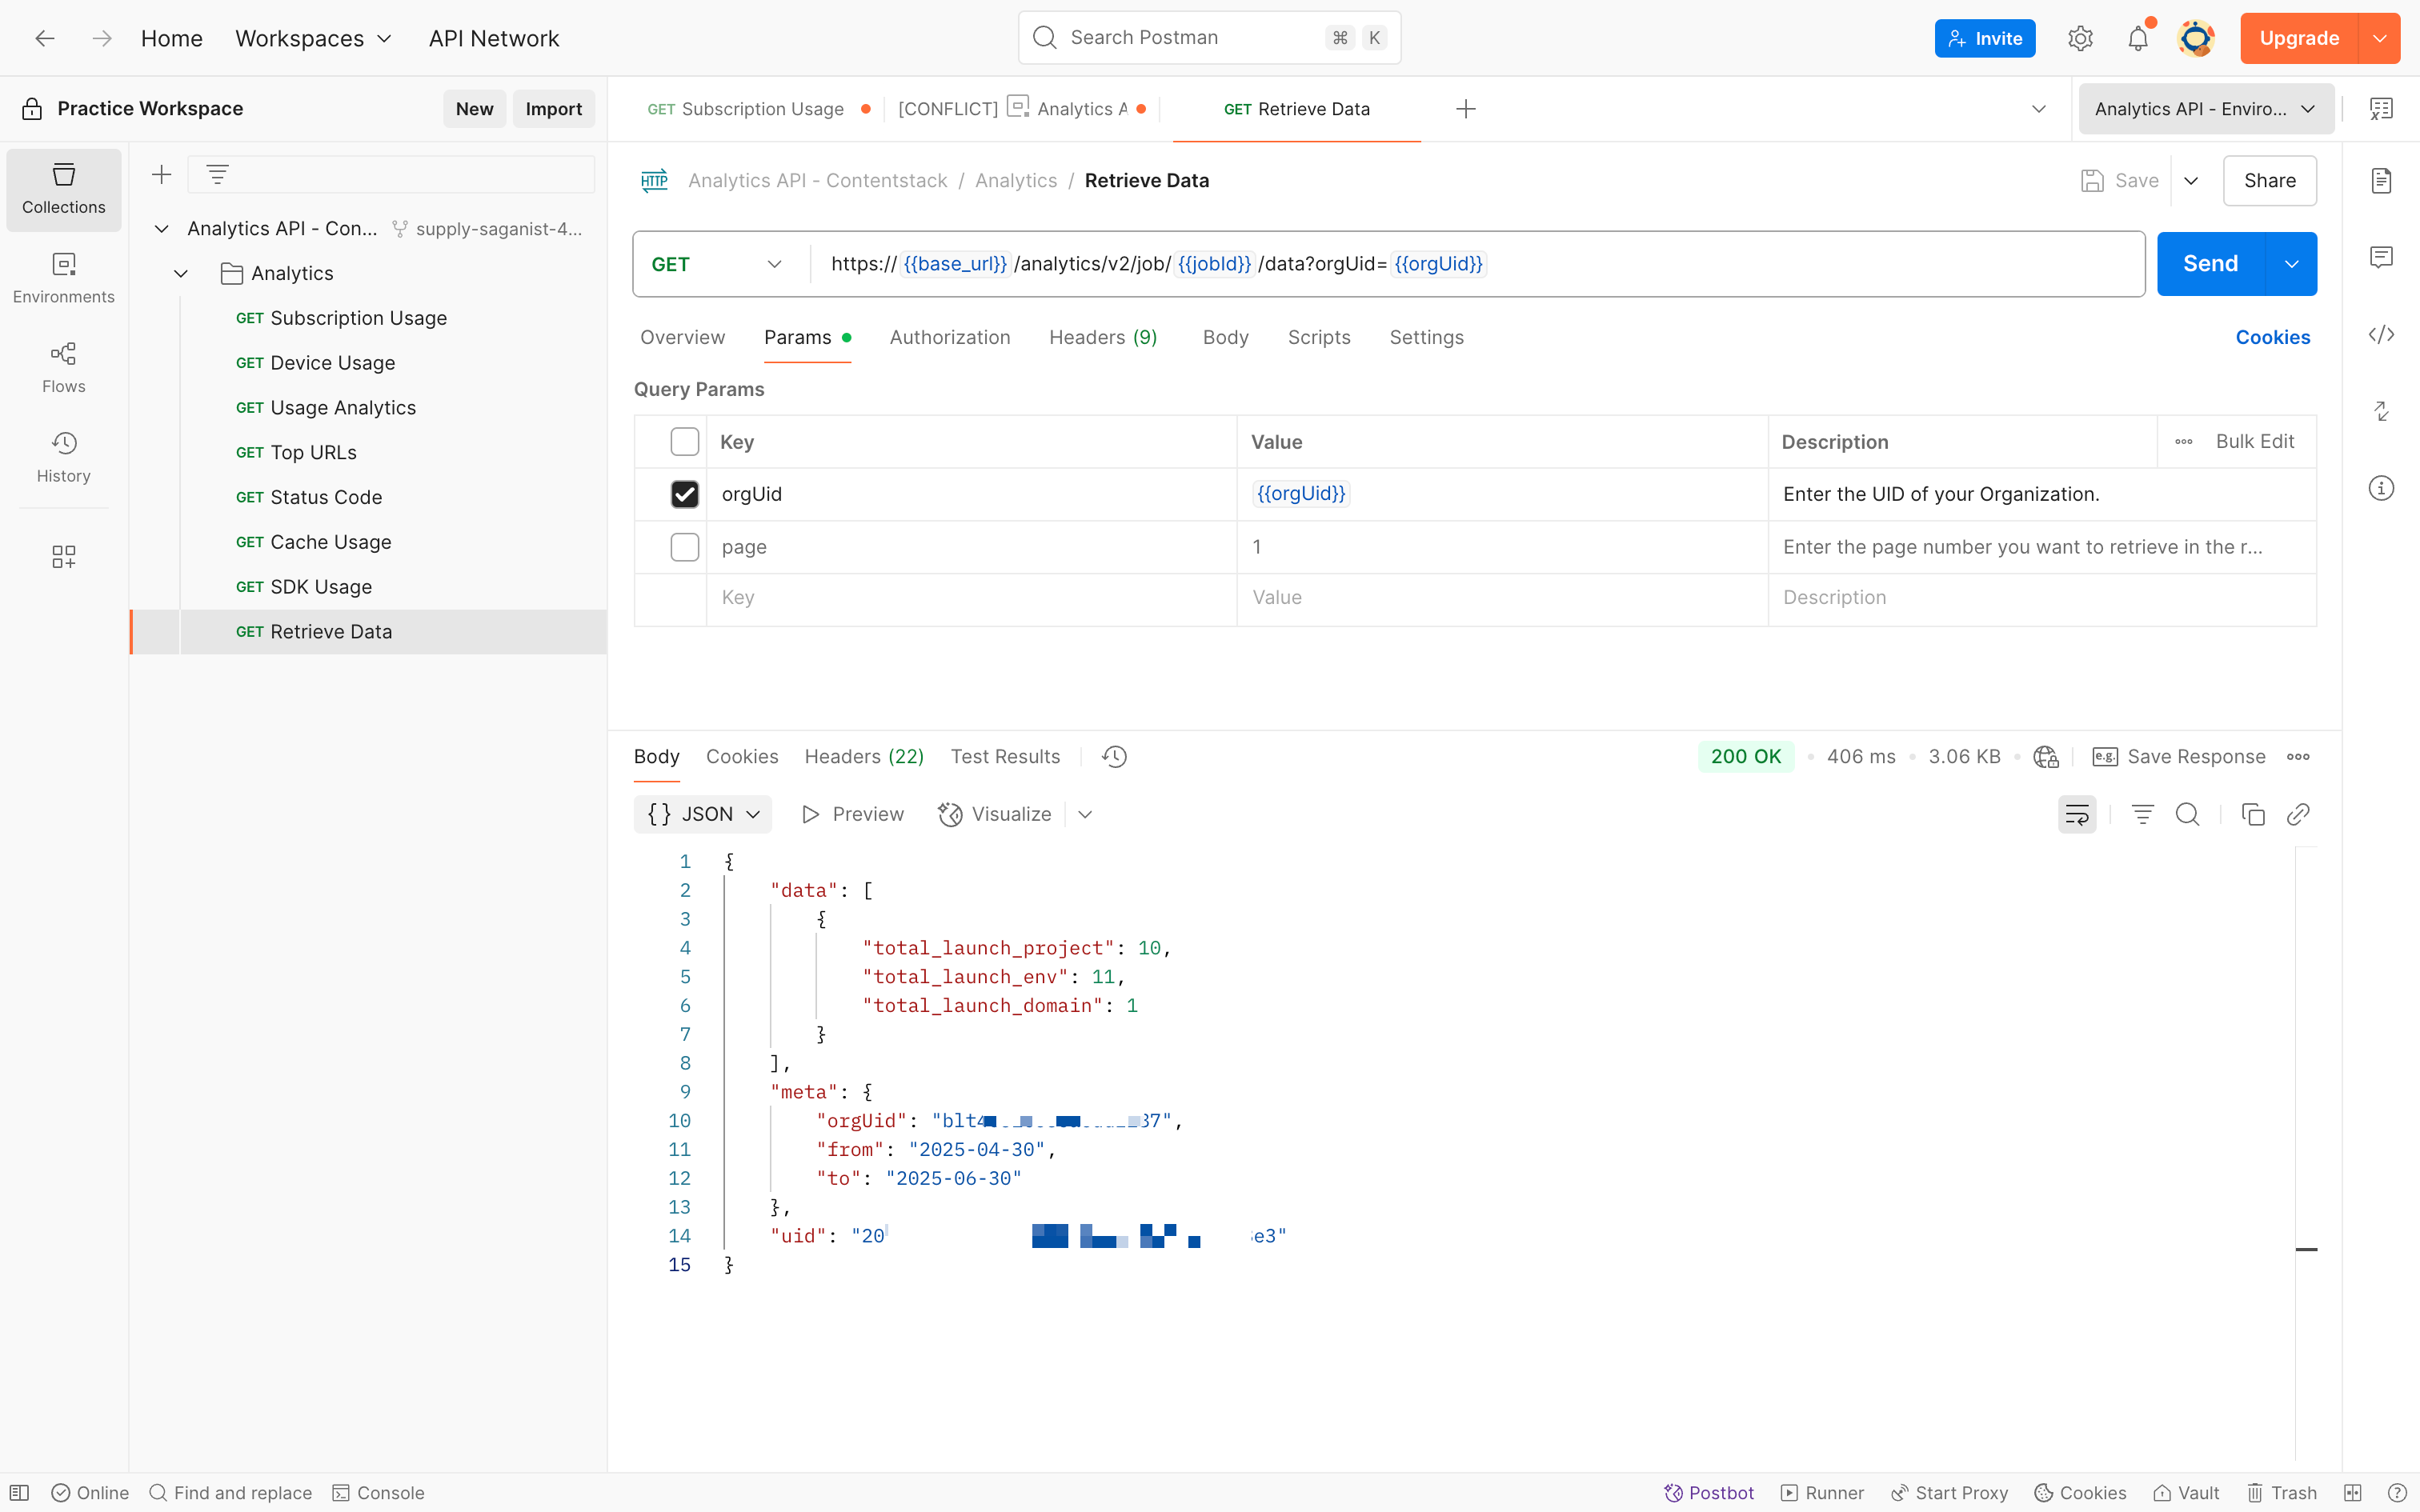
- Click Send to retrieve the actual response.
Secure Organization UID and Tokens
We strongly advise against storing your Organization UID and authtokens in your collection permanently. If you or someone else shares the collection by mistake, other users will be able to export it along with these keys.
We recommend that you provide your Automate account-specific Organization UID and tokens in your environment or directly to the sample requests.
Users using Authtoken
For users who use authtoken to authenticate their calls, when you make the Log in to your account API Request, your authtoken will be saved in cookies.
If you want to prevent this action, perform the steps given below:
- Click Cookies on the far right corner.
- In the Cookies modal under the Manage Cookies tab, click the Domains Allowlist at the bottom left.
- Add app.contentstack.com or your region specific URL and click Add.
This will allow you to access cookies of this domain in scripts programmatically.
Note: To avoid this situation, we recommend you to use the Organization UID along with the Authtoken to make valid Automate Management API requests. For more information, refer to Authentication.
Postman Collection Updates
We keep our Postman Collection updated. To get the latest version of our Postman Collection, all you need to do is to download the Postman Collection along with the updated environment again and you are good to go.
You can also choose to watch for the latest Postman Collection updates on our GitHub repository and get notifications of new releases or updates to the repository. The GitHub Readme doc will help you with the steps that you need to follow.
