

Analytics for Brand Kit
The Brand Kit Analytics dashboard gives organization Owners and Admins a centralized view of how their organization's Brand Kit is used. Use this dashboard to monitor subscription consumption, track generative AI (GenAI) request volume, review API performance, and measure Knowledge Vault activity.
Estimated reading time: 4 minutes
Skill level: Intermediate
Prerequisite
- Contentstack account
- Organization Owner or Admin permissions
What You Will Learn
-
How to navigate to the Brand Kit Analytics dashboard.
-
What each dashboard section measures and how to interpret it.
-
How to apply filters to narrow dashboard data by Brand Kit and Voice Profile.
-
How to save a filter combination as a reusable view.
Access the Brand Kit Analytics Dashboard
To access the Analytics dashboard, log in to your Contentstack account and perform the following steps:
-
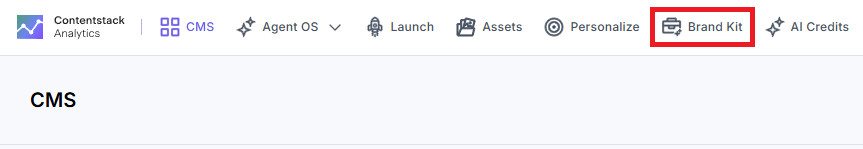
Navigate to Analytics through the "App Switcher".
-
By default, the CMS analytics dashboard appears. Click Brand Kit to switch to the Brand Kit dashboard.
Note: Data in the Brand Kit dashboard is updated every 24 hours.
Brand Kit Analytics Dashboard Sections
The dashboard is divided into several sections, each providing valuable insights into different aspects of your Brand Kit usage. These sections help you monitor and optimize your performance, resource utilization, and overall efficiency..
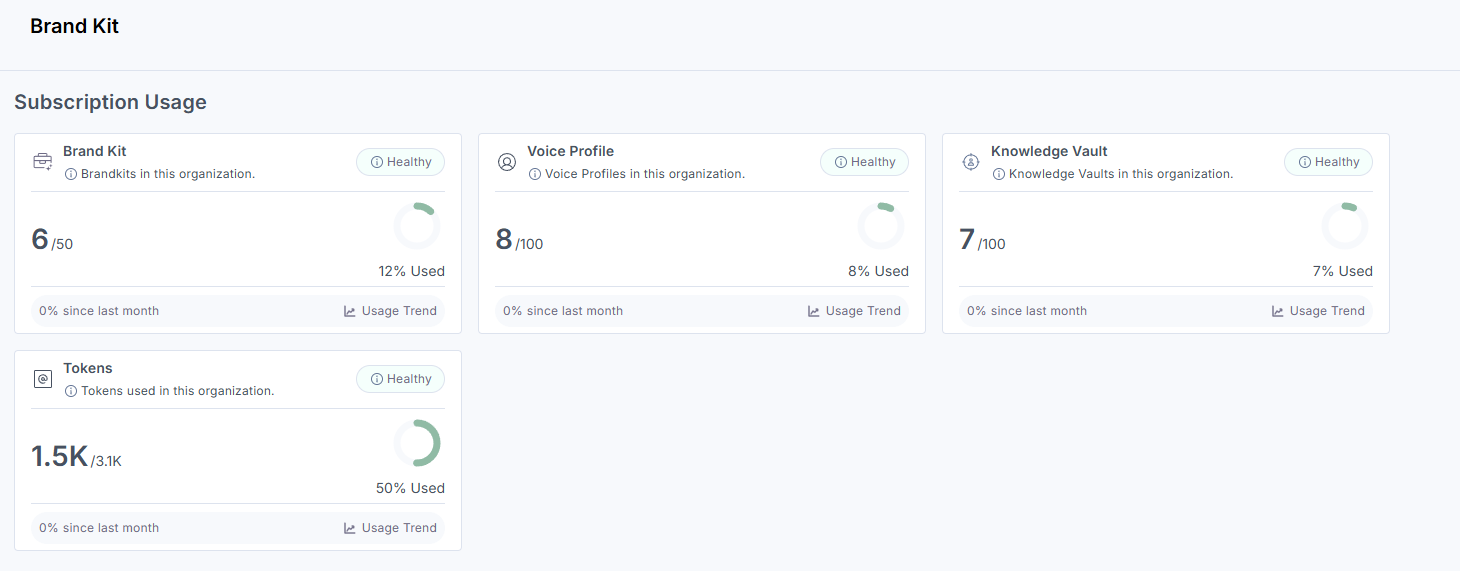
Subscription Usage
This section shows organization-level consumption totals for the current subscription period. The following metrics are displayed:
-
Brand Kit: The number of Brand Kits created within your organization.
-
Voice Profile: The total number of Voice Profiles configured.
-
Knowledge Vault: The number of items stored in the Knowledge Vault.
-
Tokens: The number of tokens consumed for GenAI requests.
Note: Token usage includes only requests sent to a Brand Kit's custom large language model (LLM). Requests that use the default Contentstack LLM (when no Brand Kit is selected) are not counted in the Tokens metric.
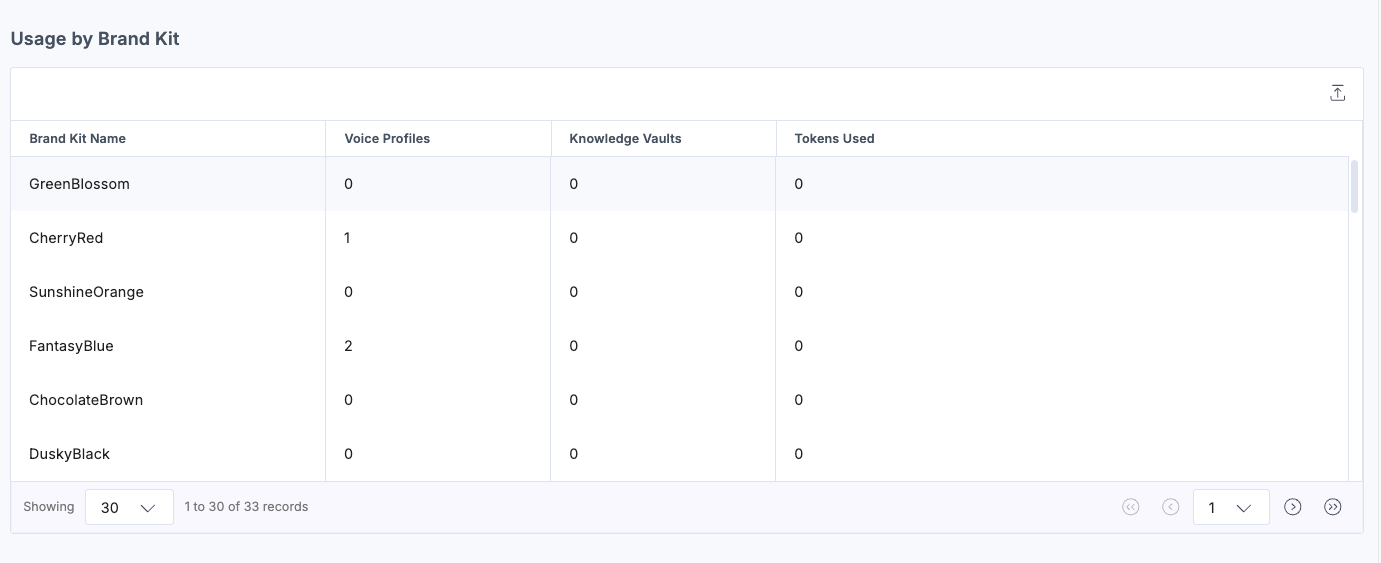
Usage by Brand Kit
This section breaks down resource consumption per individual Brand Kit. The following details appear for each Brand Kit:
-
Brand Kit Name: The name of the Brand Kit.
-
Voice Profiles: The number of Voice Profiles associated with the Brand Kit.
-
Knowledge Vaults: The number of items stored in the Knowledge Vault for the Brand Kit.
-
Tokens Used: The number of tokens the Brand Kit consumed for GenAI requests.
This data lets you compare resource consumption across Brand Kits and identify which kits are driving the most activity.
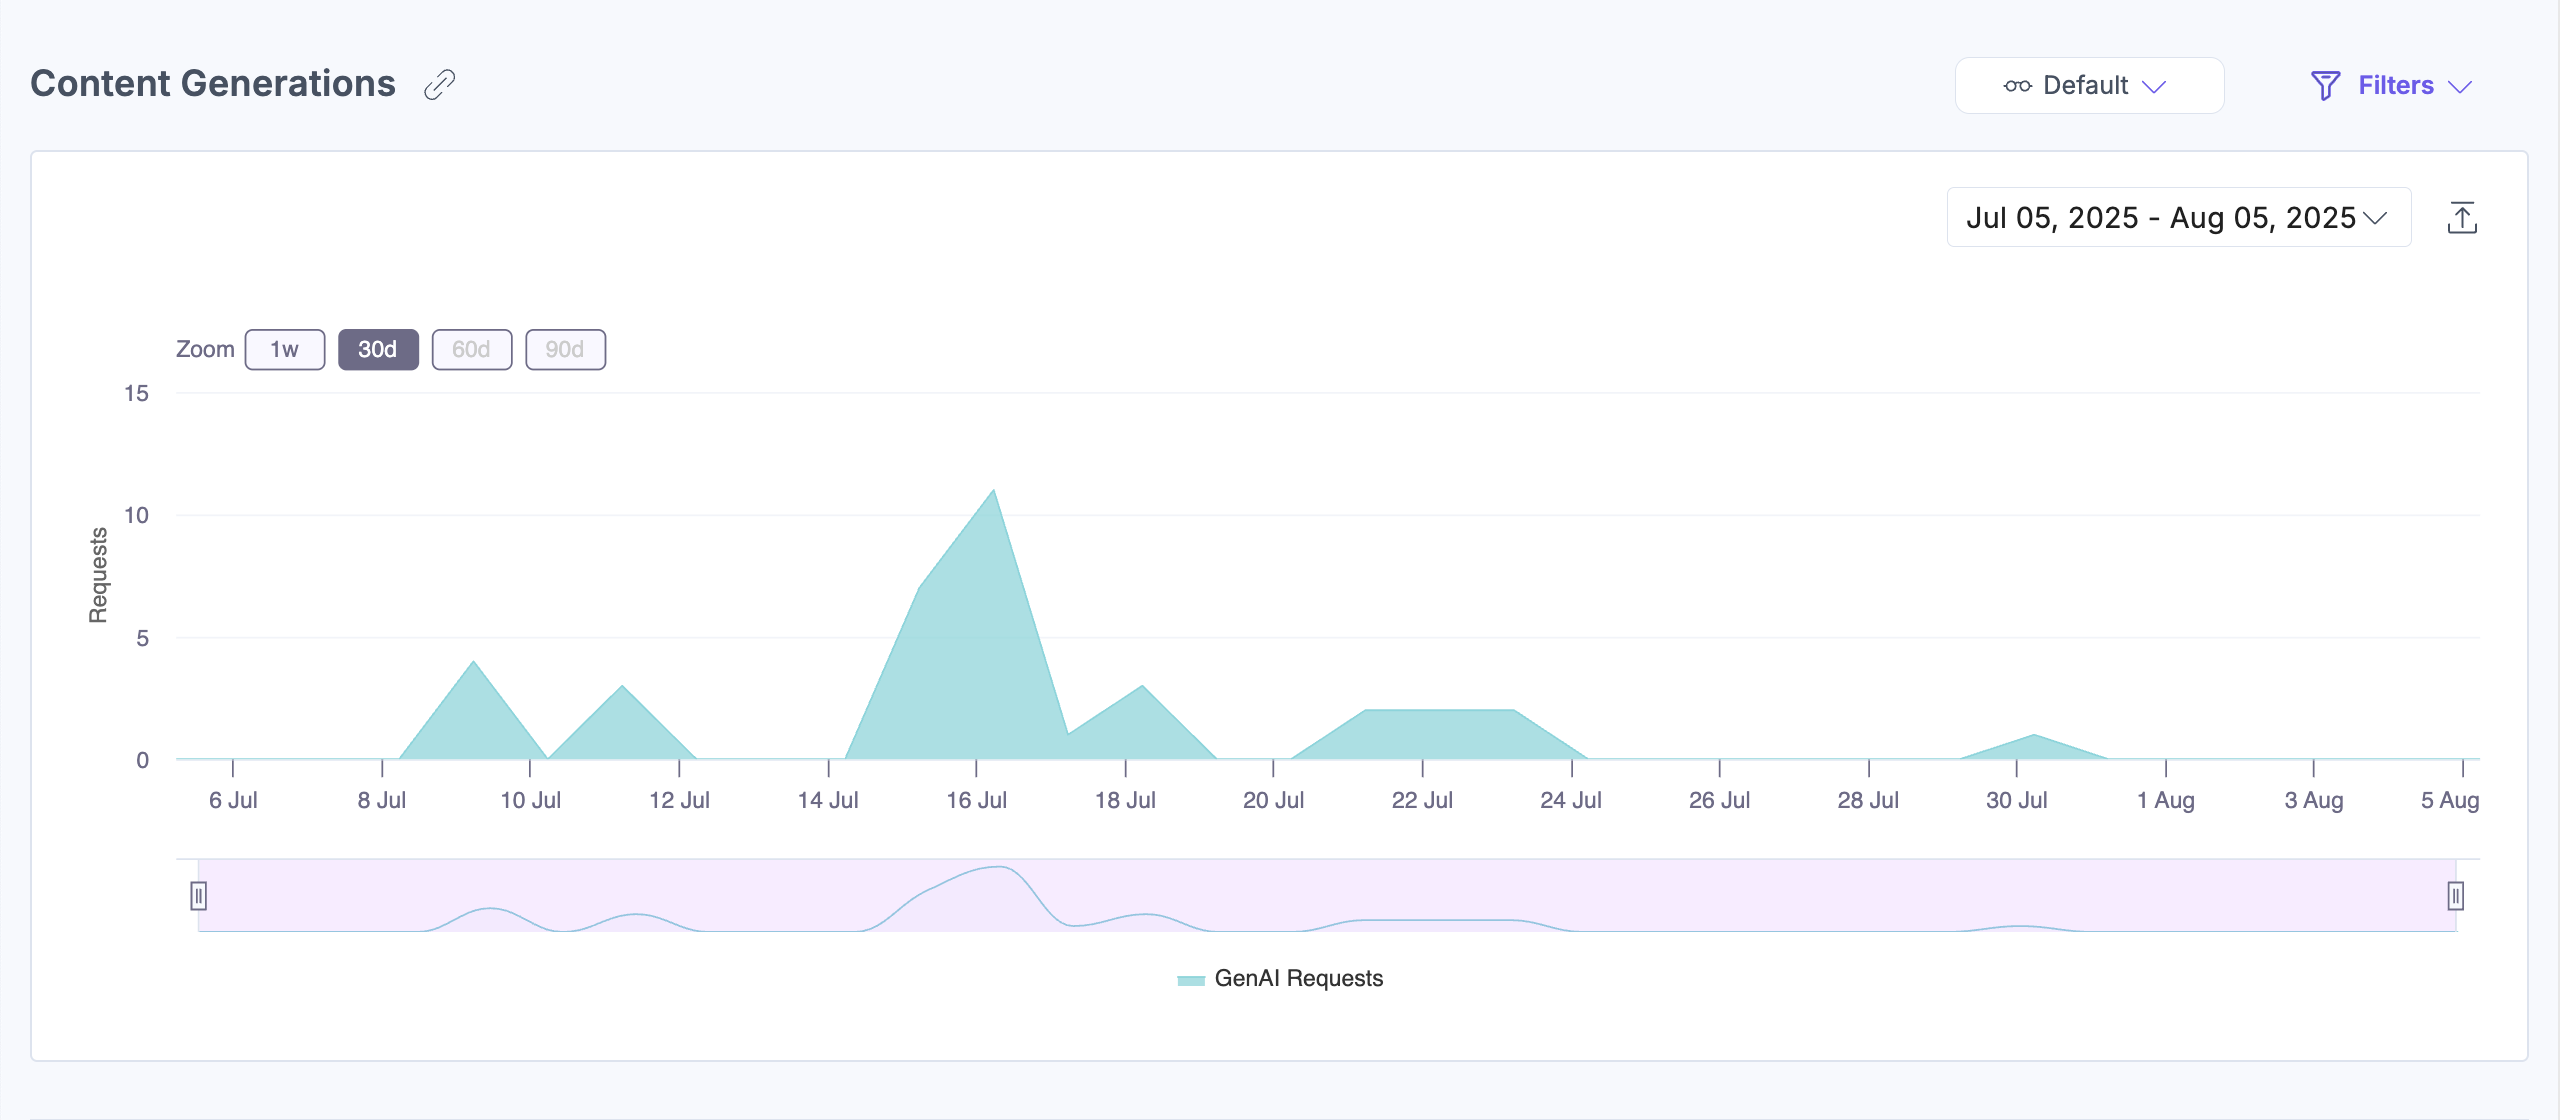
Content Generations
This section shows a time-based chart of the number of GenAI content generation requests made over a selected period. Hover over the chart to see the request count for a specific point in time.
Note: When a Brand Kit is selected during AI content generation, the chart includes only requests processed through that kit's custom LLM.
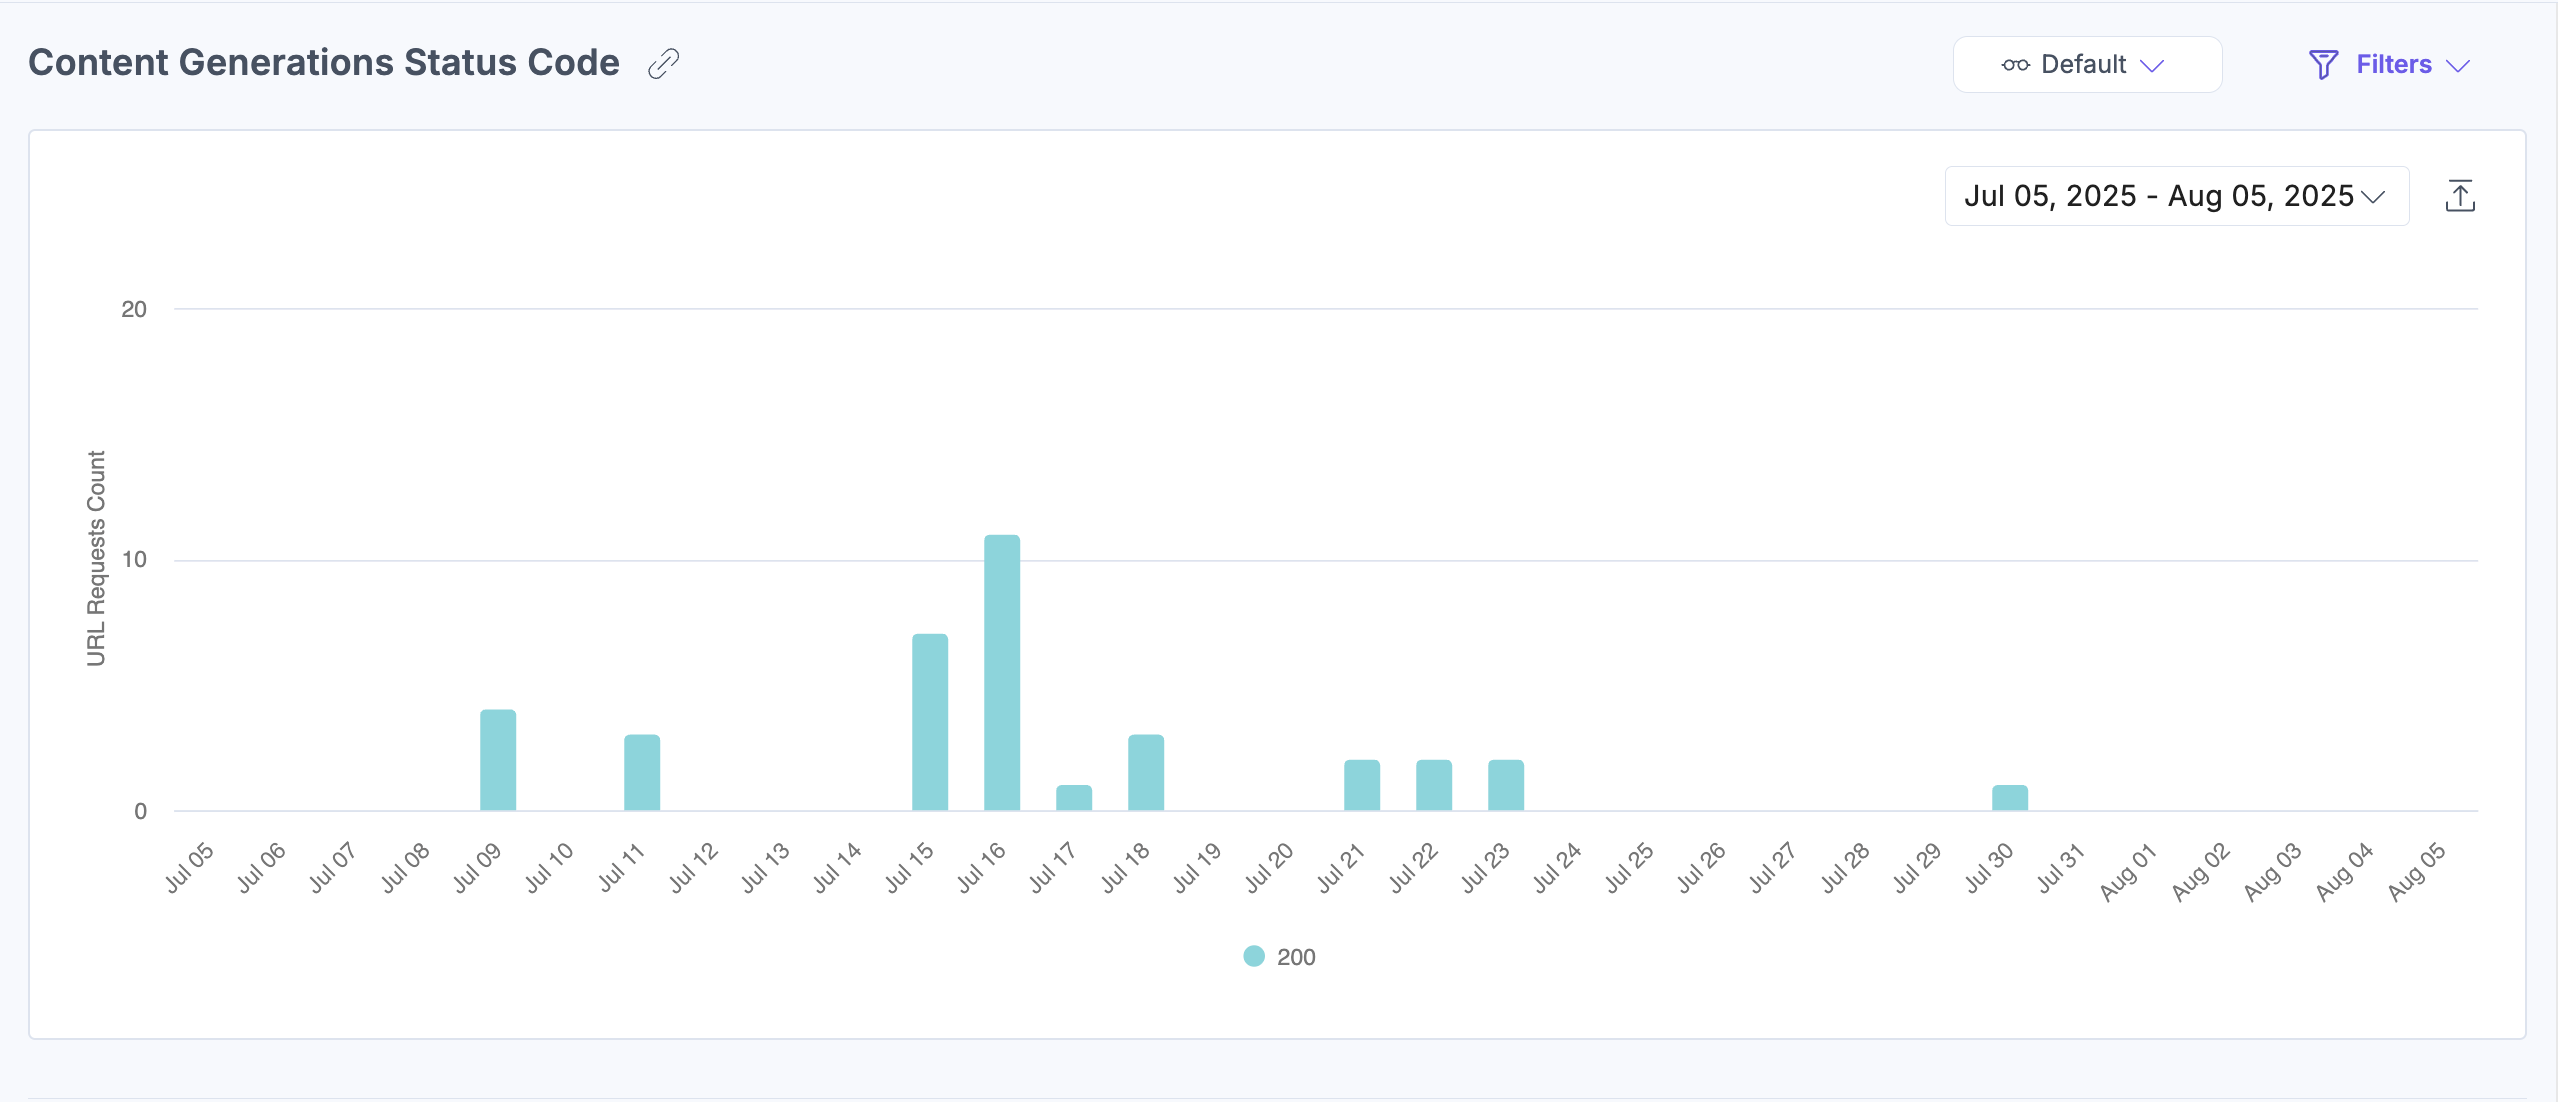
Content Generations Status Code
This section shows the number of content generation requests grouped by response status, including successes, errors, and unsupported requests. This applies to requests processed by both the default Contentstack LLM and any custom LLMs linked to Brand Kits.
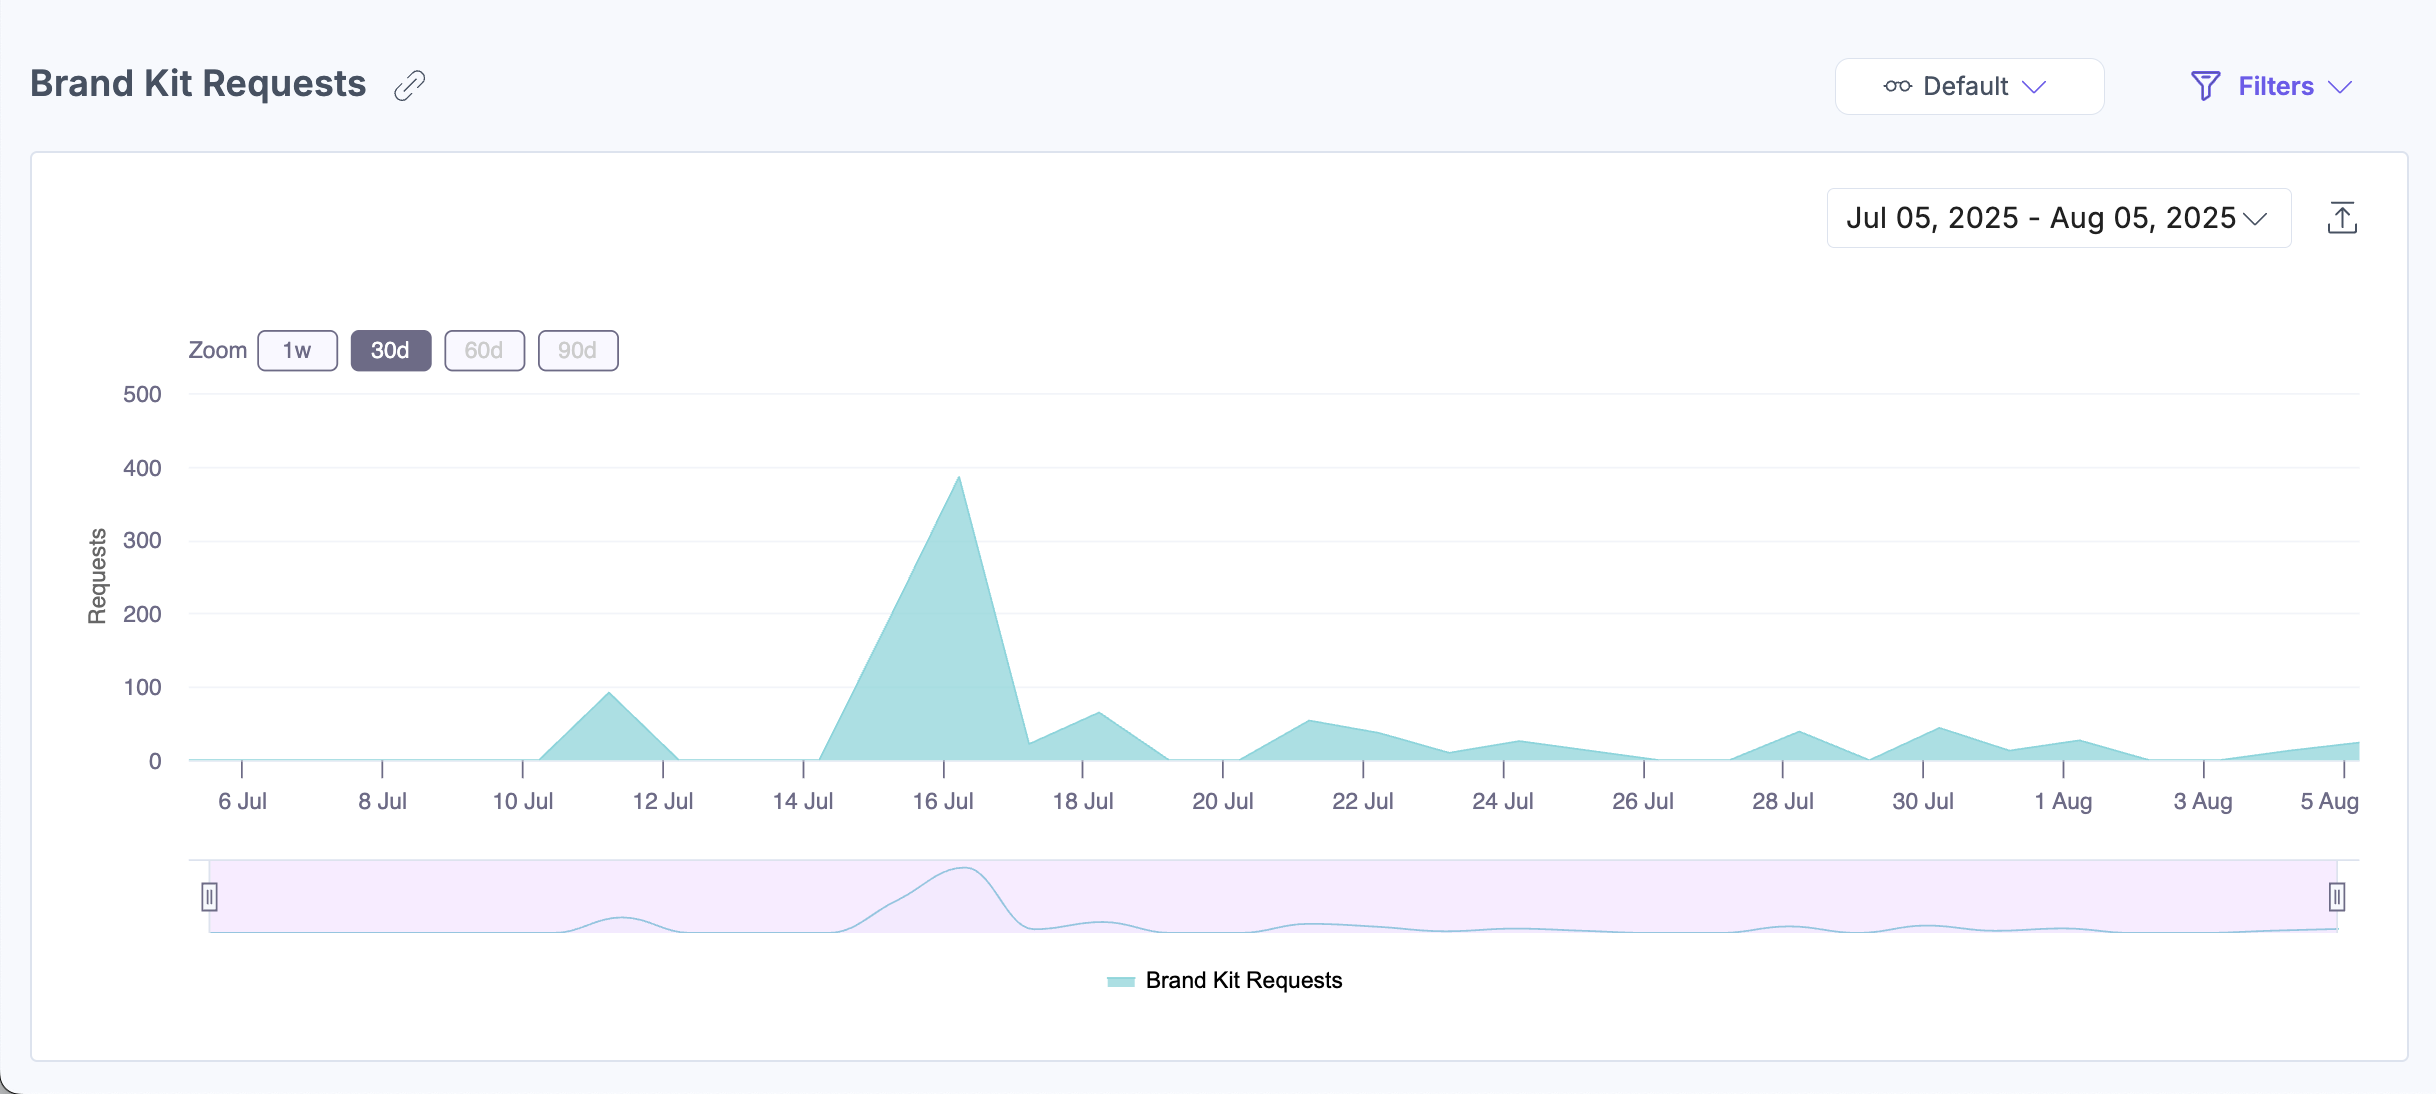
Brand Kit Requests
This section shows the volume and frequency of Brand Kit requests over time. Hover over the chart to inspect the request count for a specific point in time.
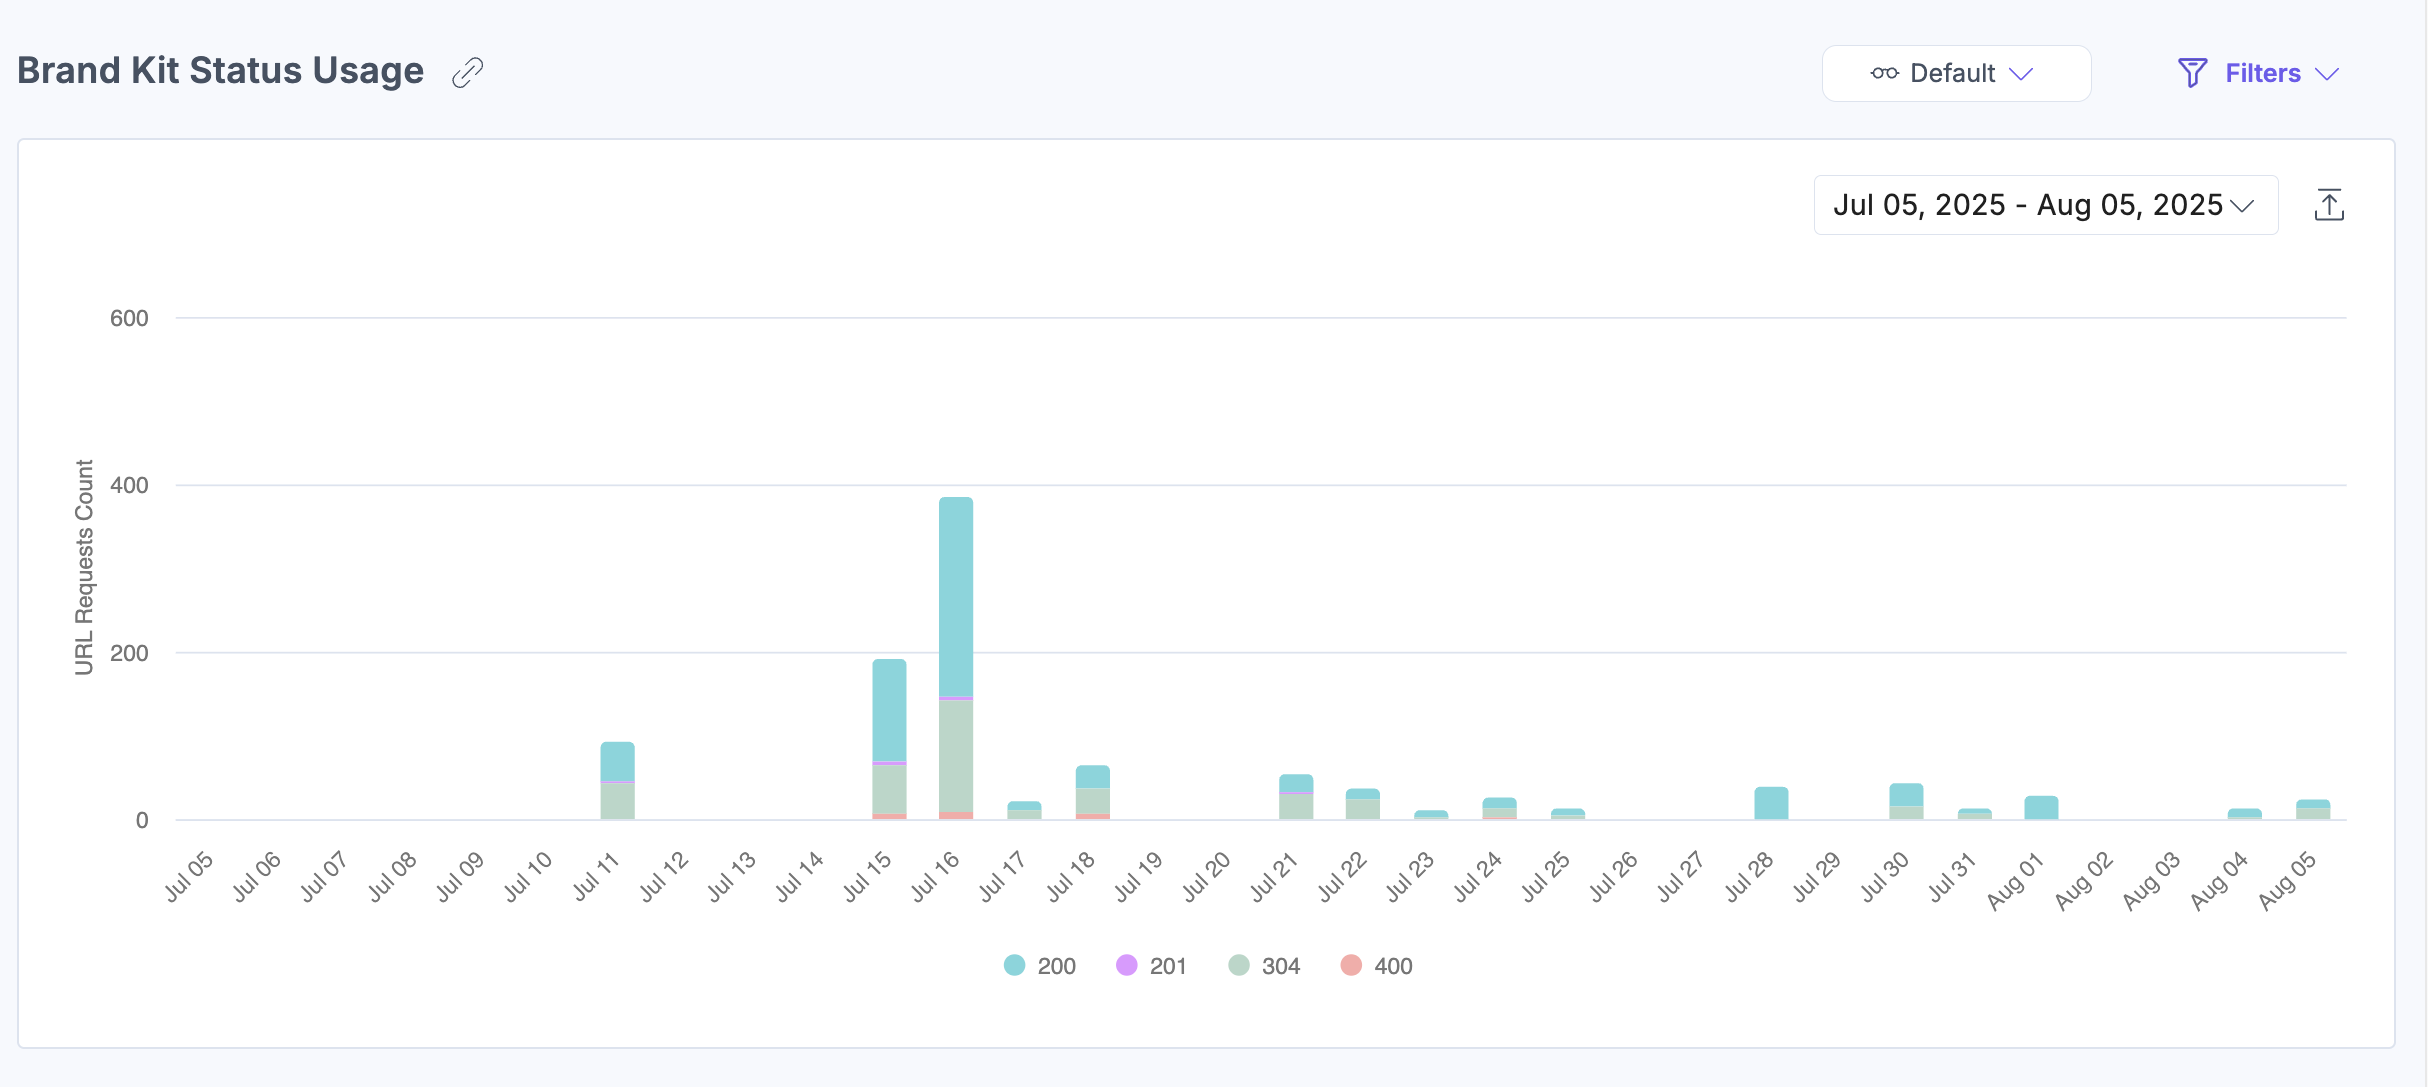
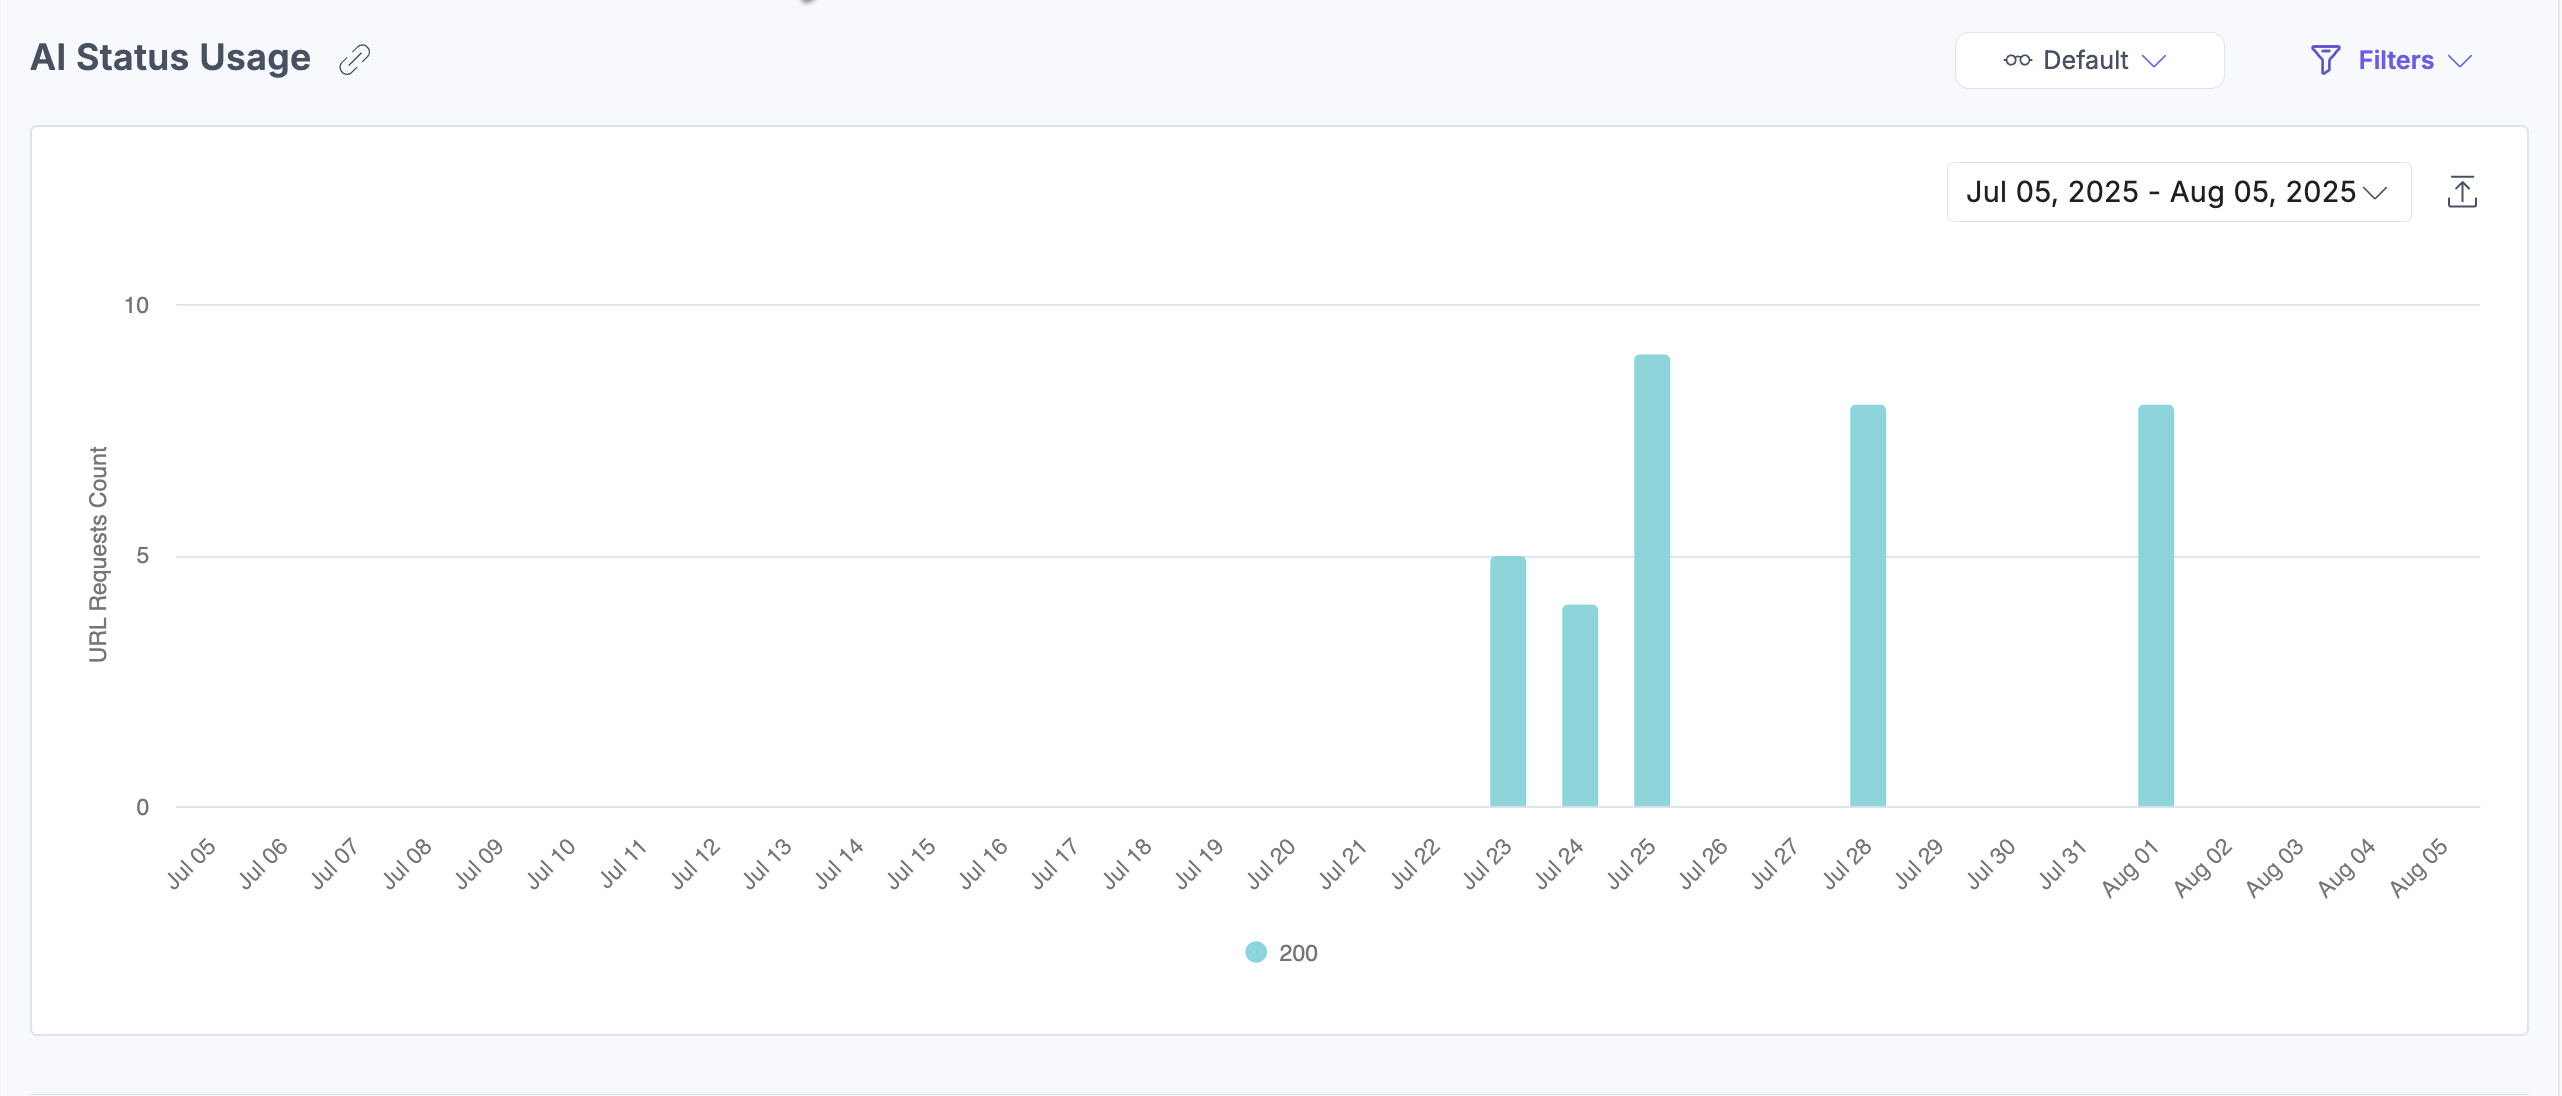
Brand Kit Status Usage
This section shows the number of Brand Kit URL requests grouped by response status, including successes, errors, and unsupported requests. Use this data to assess API performance and investigate issues.
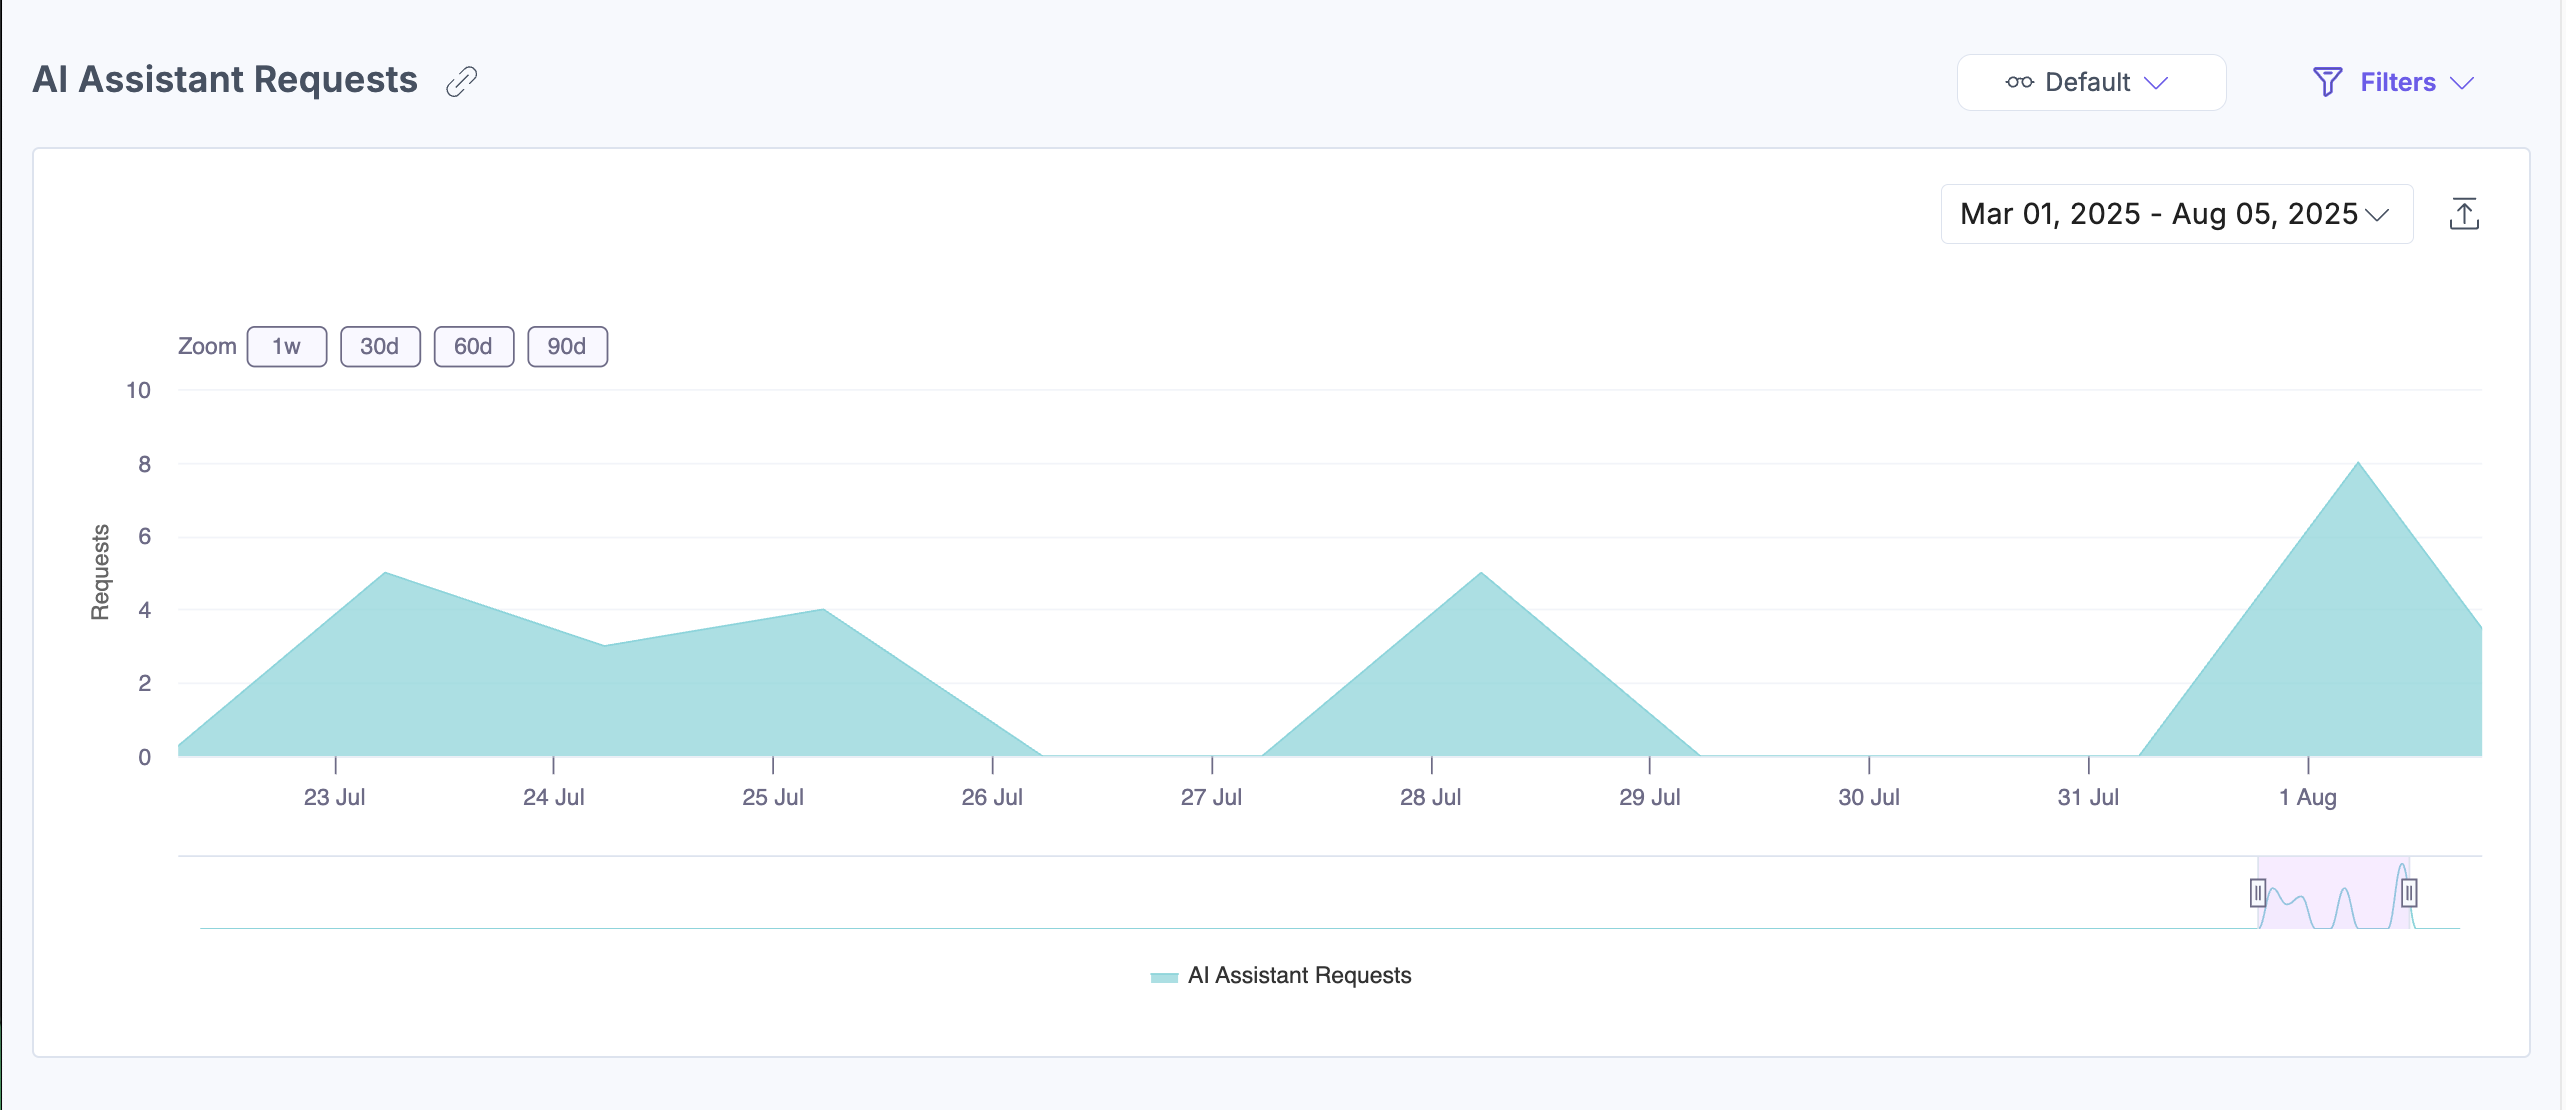
AI Assistant Request
This section shows how frequently the AI Assistant is used over time. Hover over the chart to see the request count for a specific point in time.
Note: When a Brand Kit is selected, the chart displays requests processed by that kit's custom LLM. When no Brand Kit is selected, it displays requests processed by the default Contentstack LLM.
AI Status Code Usage
This section shows the number of AI Assistant API requests grouped by response status, including successes, errors, and unsupported requests. Use this data to assess API performance and investigate issues.
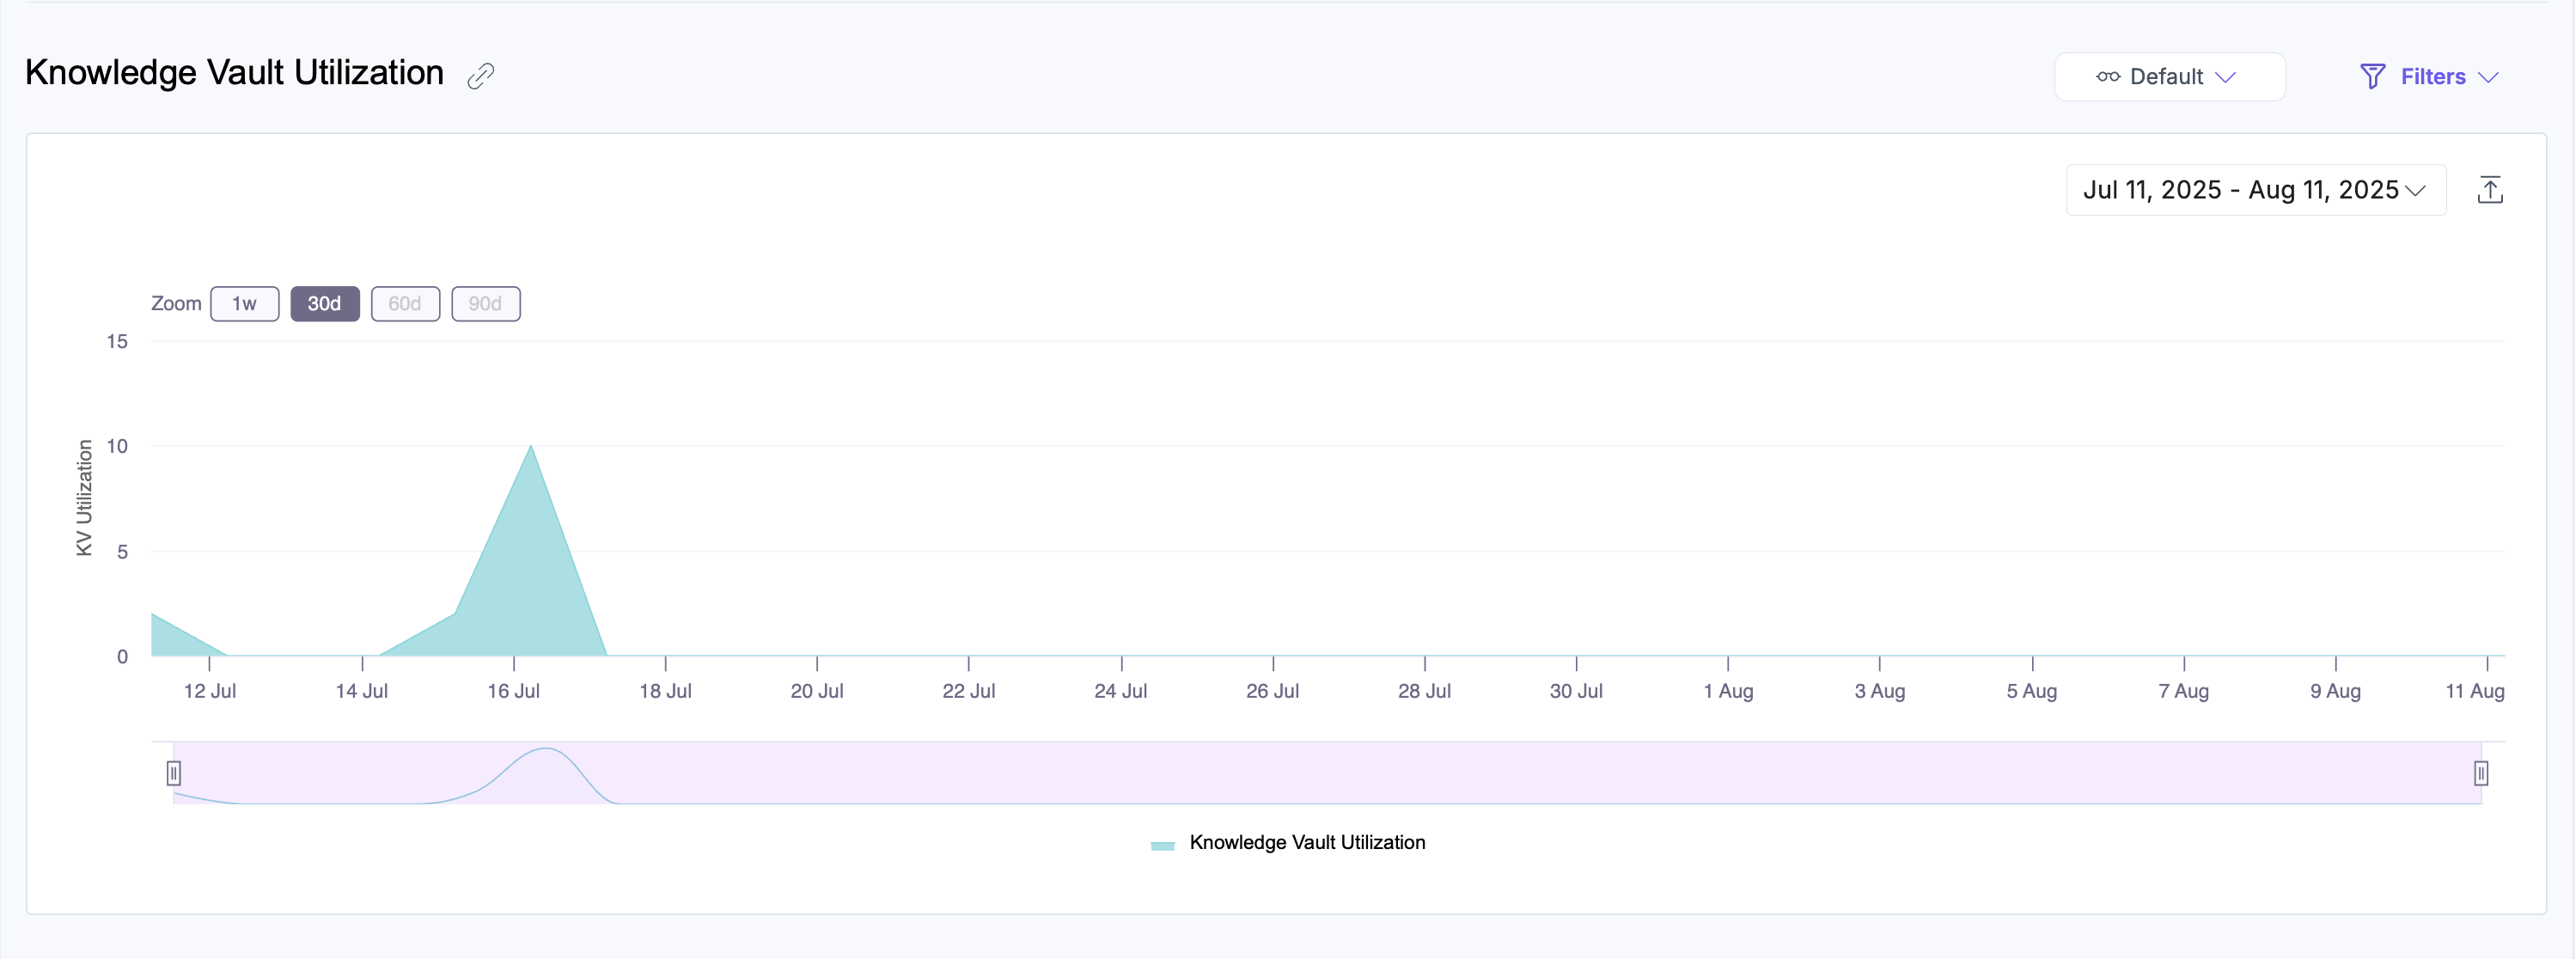
Knowledge Vault Utilization
This section shows usage trends for the Knowledge Vault, reflecting how actively the vault is being accessed or updated over time.
Note: This section applies only to content generation requests where a Brand Kit is selected. Activity from requests using the default Contentstack LLM (without a Brand Kit) is not included.
Apply Filters and Manage Views
To filter dashboard data, click Filters, select your options, and then click Apply Filter(s).
The following filters are available:
-
Brand Kits: View metrics for a specific Brand Kit or for all Brand Kits together.
-
Voice Profiles: View metrics for a specific Voice Profile or for all Voice Profiles together.
-
Stacks: View AI Assistant metrics for a specific stack or for all stacks together.
-
Status Code: Filter by specific response codes.
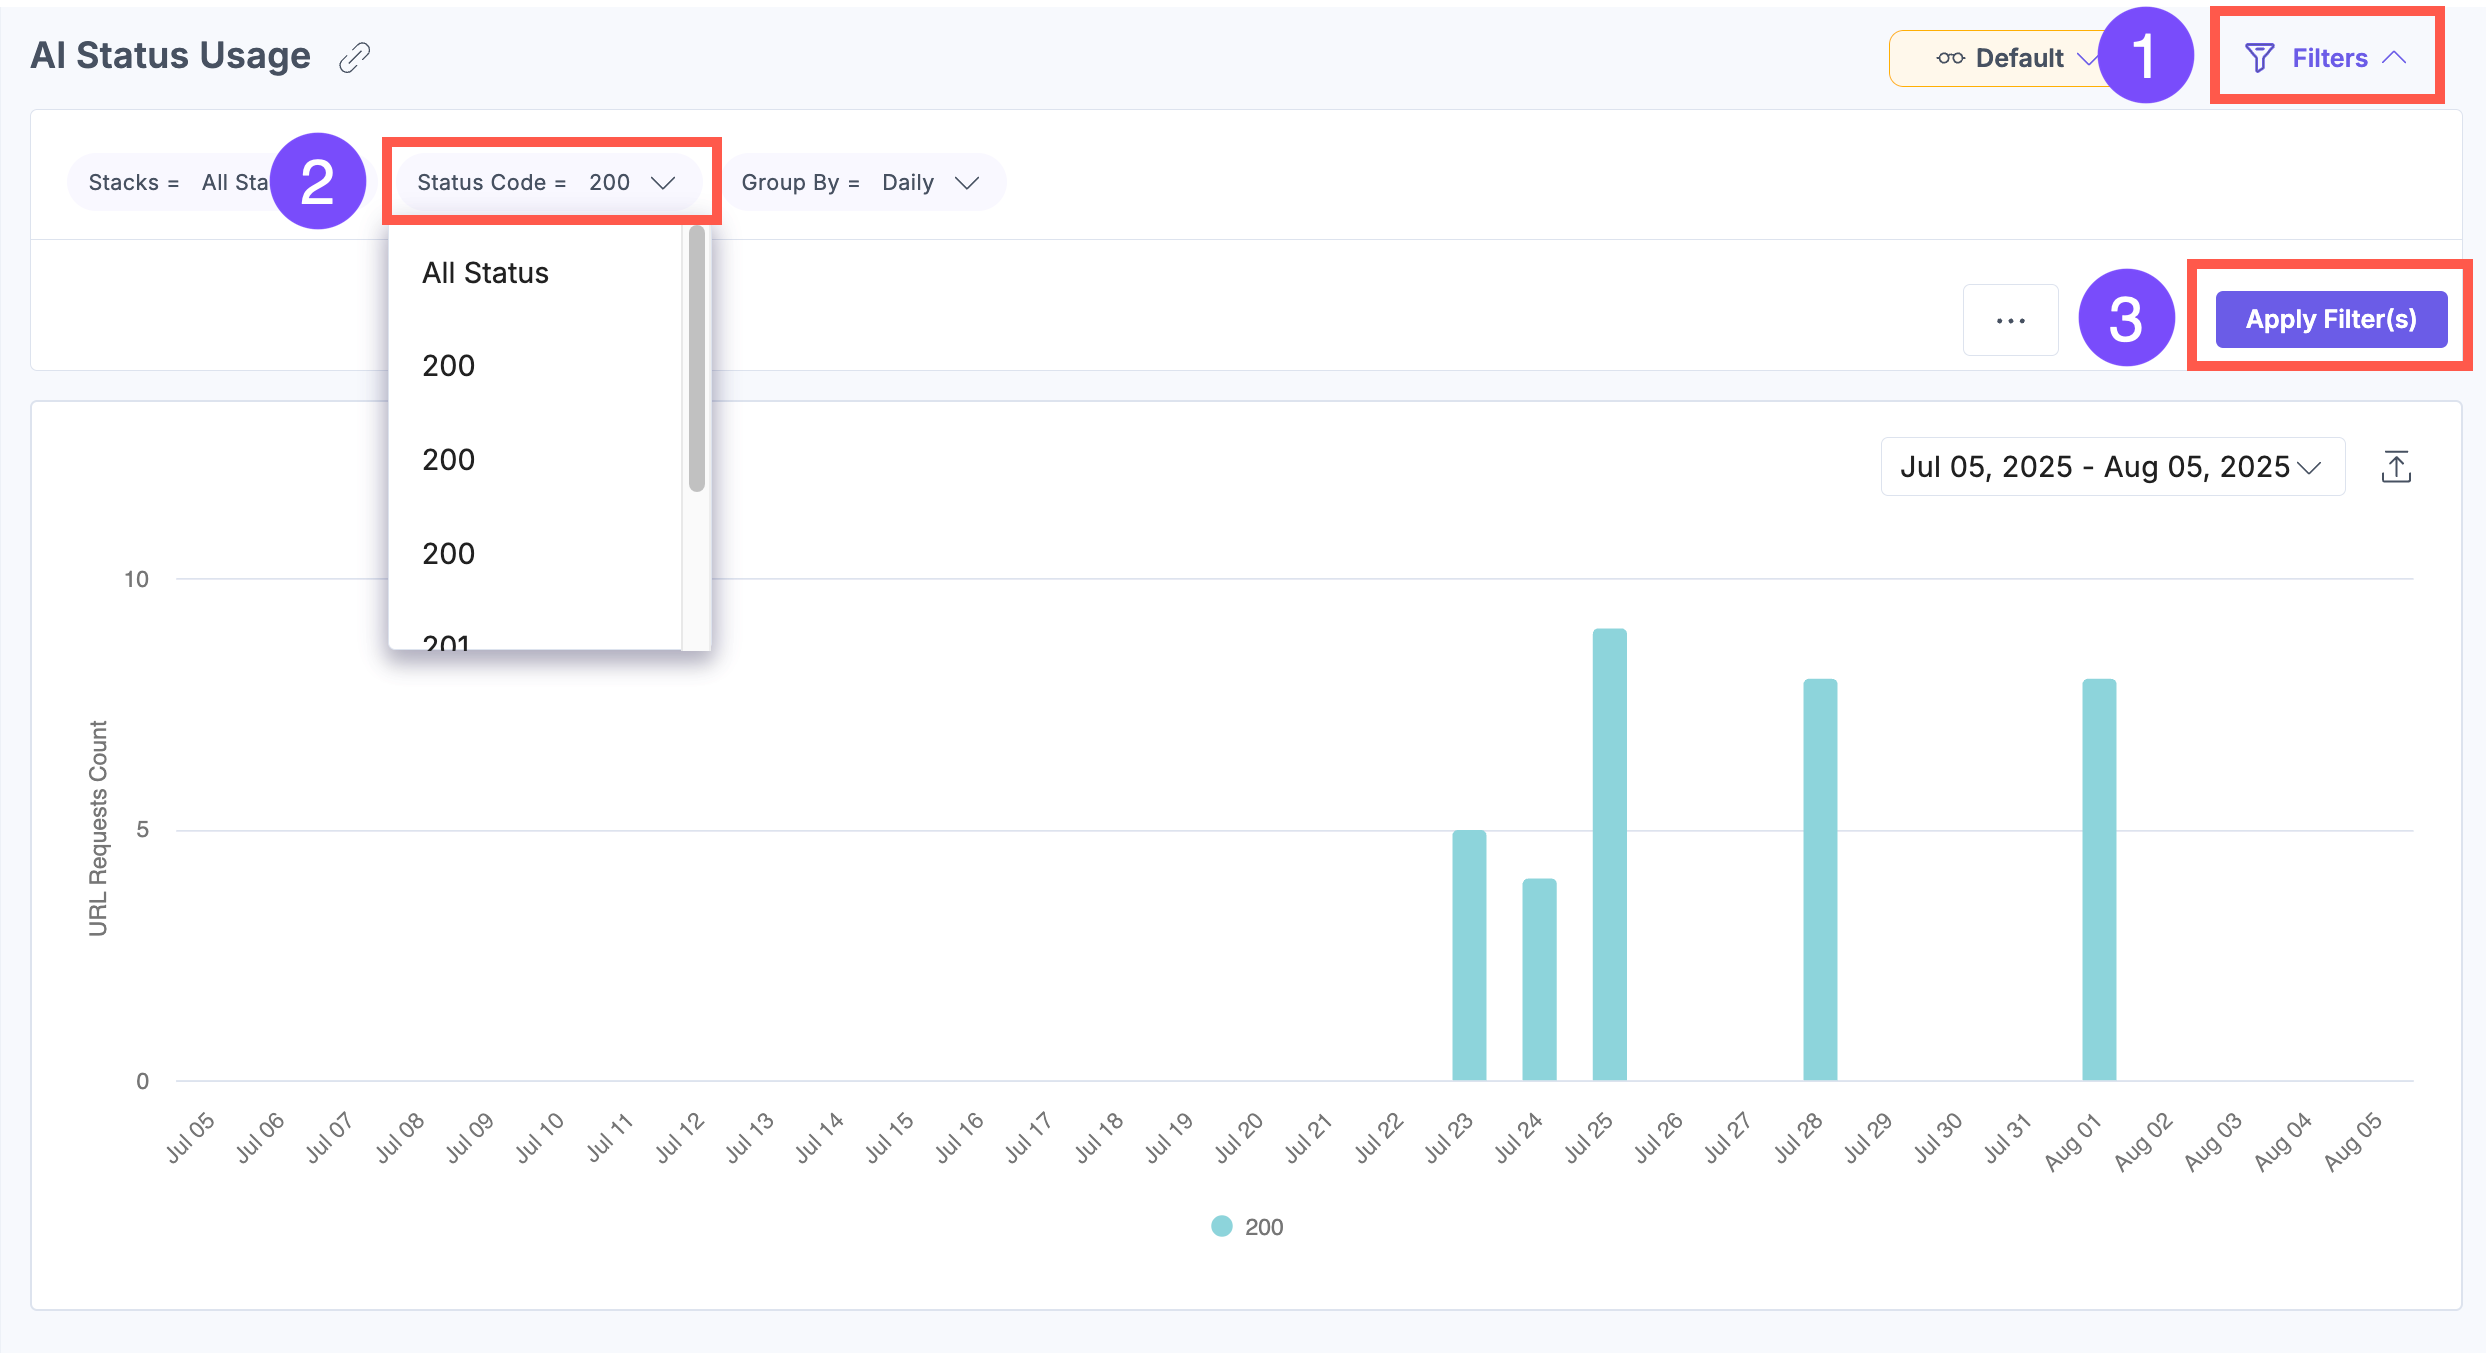
-
Group By: View data grouped by day, week, or month.
.gif)
-
Date Range: Choose from 1 week, 30 days (default), 60 days, or 90 days. Some charts include a timeline selector for further refinement.
-
Custom Date: Set a specific date range using the dropdown.
.gif)
Note: The custom date range cannot exceed 90 days.
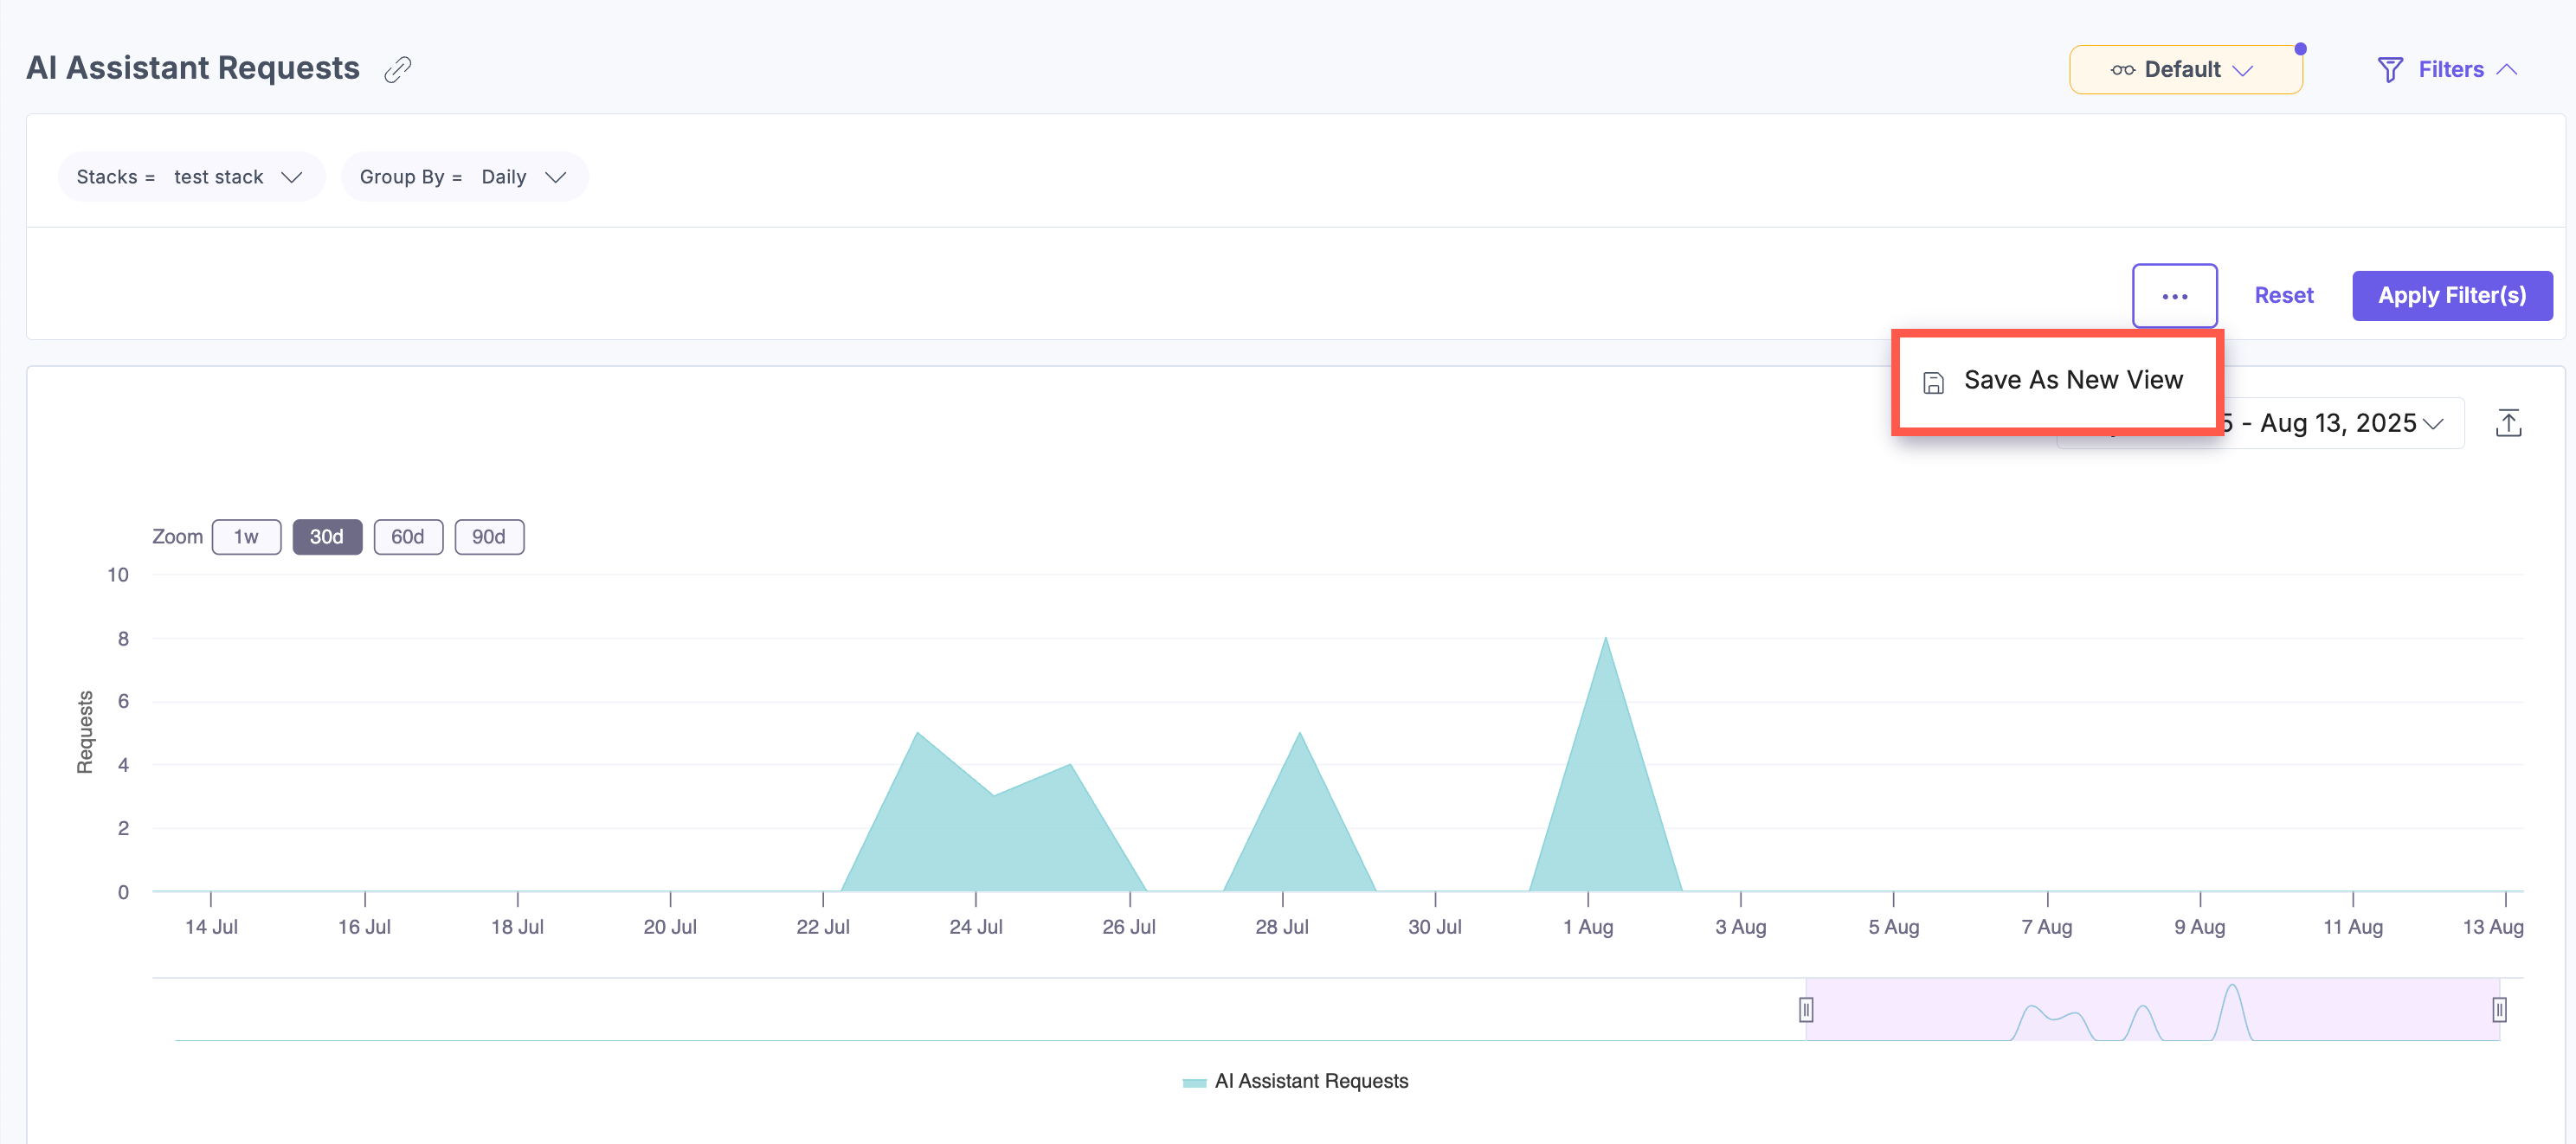
To save a filter combination for later use, click the horizontal ellipsis (...) next to Reset and select Save As New View.
The saved view appears in the dropdown menu. You can select it at any time to restore your filter settings without reapplying them manually.
Related Resources
-
Analytics API: Retrieve and analyze Brand Kit metrics programmatically across your organization.
-
Brand Kit Management API: Create, update, and delete Brand Kits and Voice Profiles via the API.
-
About Analytics: Explore Analytics dashboards for CMS, Launch, Automate, and Personalize alongside Brand Kit.
-
Brand Kit FAQs: Answers to common questions about Brand Kit configuration and usage.
More articles in "Work with Analytics"
