

Experience Analytics
Experience Analytics are crucial for understanding user interactions with content and enabling data-driven personalization. By collecting and analyzing user data, you can uncover behavior, preferences, and motivations, allowing for targeted experiences that boost engagement, conversions, and overall business success. You can use experience analytics in Contentstack Personalize to improve your content personalization strategies by:
- Identifying high-performing content: By analyzing user engagement metrics, you can pinpoint which content resonates most with your audience and personalize experiences by recommending or promoting similar content to individual users.
- Understanding user preferences: Analyzing user interactions with different content types, formats, and topics can reveal valuable insights into their preferences. This information can be used to tailor content recommendations and personalize the overall user experience.
- Optimizing content for different audience segments: By segmenting your audience based on demographics, behavior, or other relevant criteria, you can use experience analytics to understand the unique preferences of each segment and personalize content accordingly.
- Testing and refining personalization strategies: Experience analytics allows you to experiment with different personalization tactics and measure their impact on user engagement and conversions. This data-driven approach helps you continuously optimize your personalization strategies for better results.
Note: After an event is triggered, it may take up to a minute for the count to update on the Analytics page.
Note: The analytics data available in Personalize is only retained for the past 6 months (rolling window). Data older than 6 months is automatically deleted and cannot be retrieved.
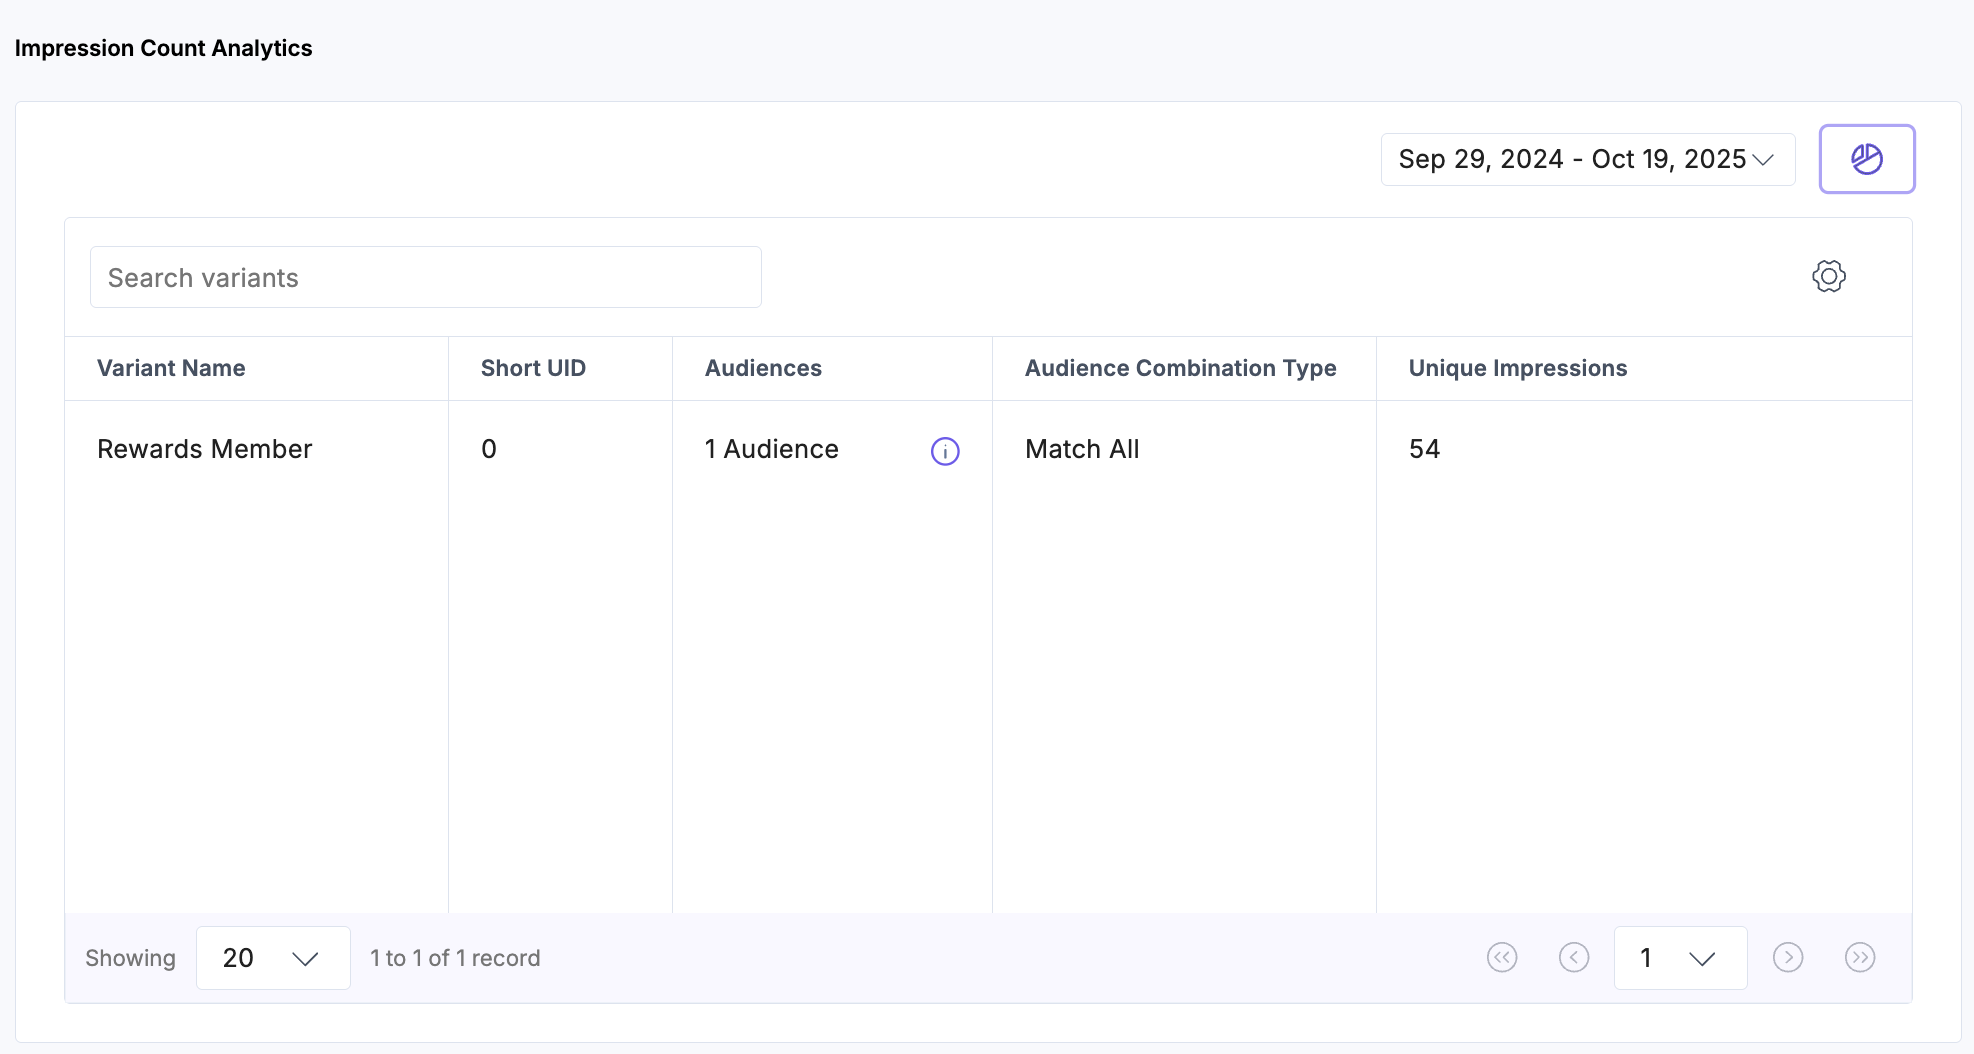
Segmented Experience Analytics
For Segmented Experiences, analytics track and display only impressions when activated.
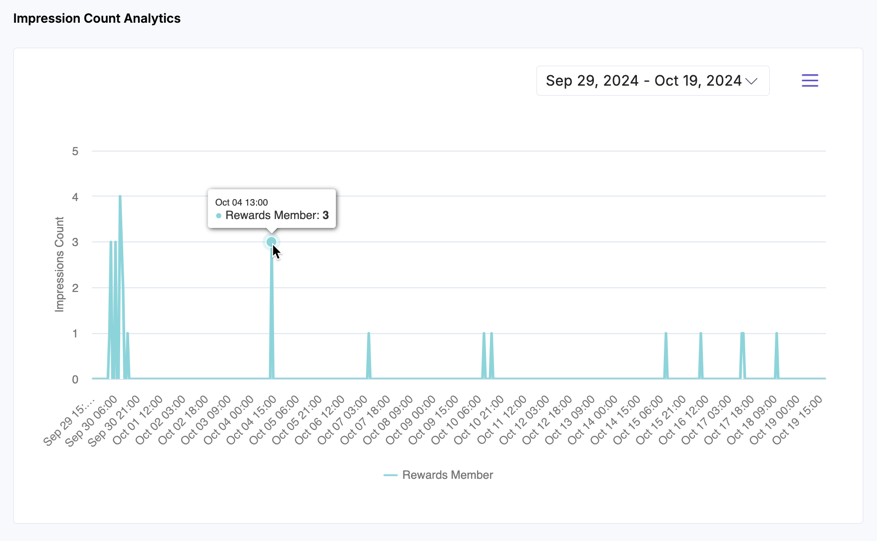
Note: Toggle to the table view to see a detailed summary.
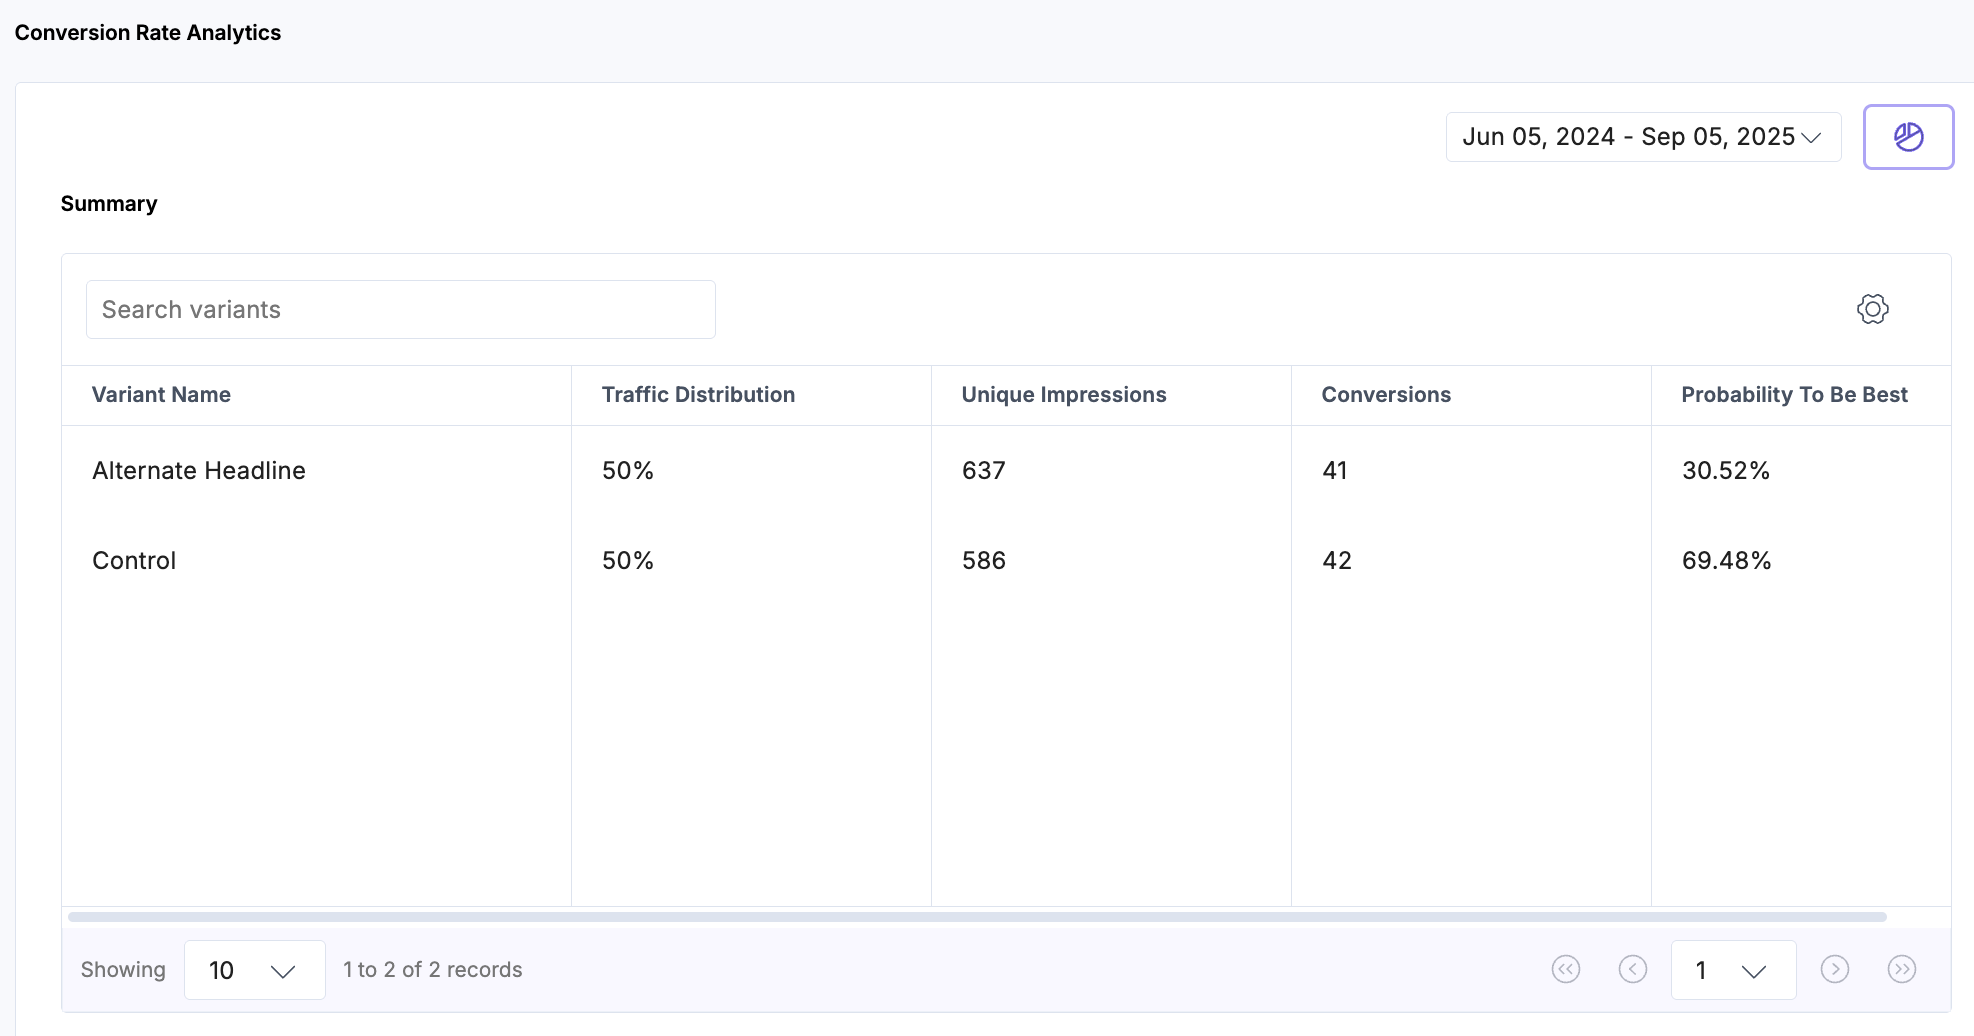
A/B Test Experience Analytics
For A/B Test Experiences, analytics track and display impressions and conversions when activated.
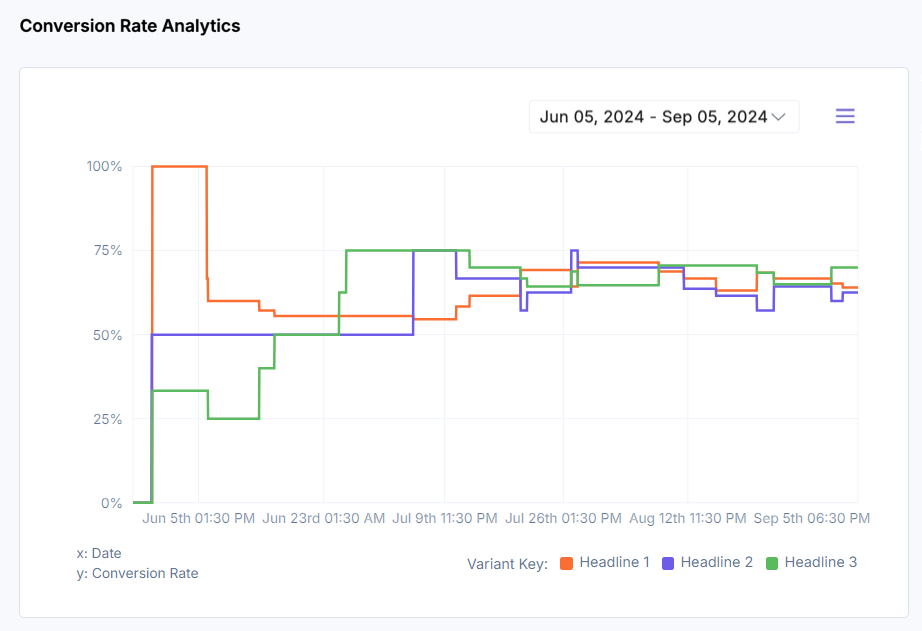
Note: Toggle to the table view to see a detailed summary.
Minimum requirements to calculate insights
Once the A/B Test experience is activated, we wait for one of the following conditions to be met before calculating insights:
- Either a total of at least 1000 impressions across all variants
- Or at least 30 conversions across all variants.
Once either condition is satisfied, users can access near-real-time summary reports and insights to identify the best-performing variant
Note: An event is counted as a conversion only if it is attributed to an impression. Attribution occurs when a conversion takes place within 30 days of the corresponding impression.
Insights Calculation
Personalize uses Probability to be Best (P2BB) to determine how to allocate variants to users. The P2BB is based on a Bayesian statistical approach.
The Bayesian approach starts with some rough expectations about the value you are trying to estimate. As it begins recording actual data, the expectation gets updated. Over time, the curve becomes tighter and more precise, because more data gives more confidence about what the value really is.
In this framework, probability expresses how certain or uncertain you are, based on your prior knowledge plus the data you’ve observed. Bayesian probability is essentially a tool for tracking and updating your confidence as information accumulates.
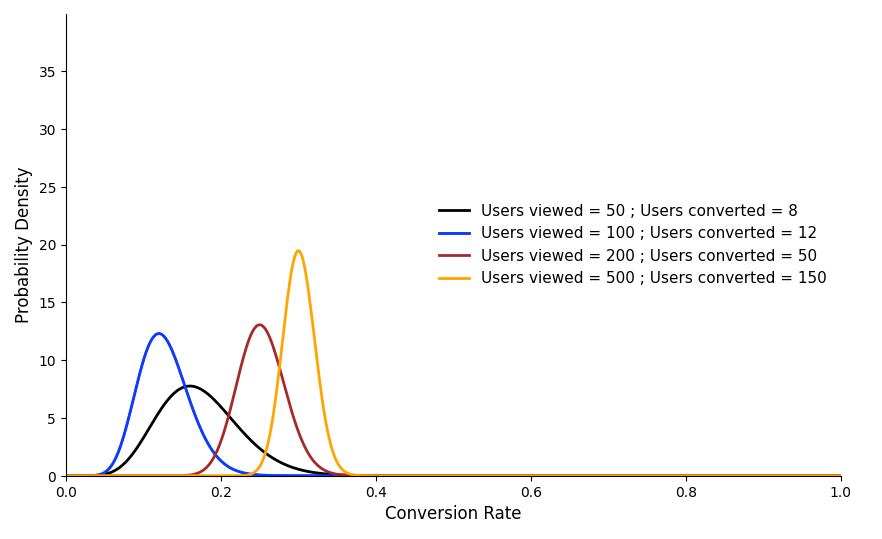
The plot above illustrates the convergence process of the distribution as the events (impressions and conversions) are collected. Note how the bell shape becomes sharper as more events are registered eventually.
Mathematics Behind Insights Calculation
The Probability to Be Best (P2BB) for each variant in an A/B test is calculated using the Bayesian approach (as discussed above).
This method models the conversion rate of each variant as a Beta Distribution.
The P2BB represents the probability that a given variant has the highest true conversion rate among all tested variants, based on the observed data.
Terminology
Prior: A constant and uninformative prior is used, parameterized by alpha and beta. This ensures the results are driven primarily by the new data.
Beta Function: A mathematical function that generates a Beta Distribution based on prior belief and new evidence.
In an A/B test, the Beta function takes two arguments:
- Prior Alpha + Conversions
- Prior Beta + Non-Conversions
Posterior: Represents the updated knowledge after the test. It is the Beta Distribution produced by the Beta function.
Random values are sampled from each variant’s Posterior Distribution to enable comparison.
Random Samples: Since the Posterior Distribution is continuous, discrete samples are required for comparison. For each variant, 15,000 random values are extracted from its Posterior Distribution.
Each sample represents one possible estimate of that variant’s true conversion rate.
Step-by-step Calculation:
- Calculate Non-Conversions: For each variant, determine the number of non-conversions (Impressions - Conversions).
- Determine the Posterior Distribution:
Feed the conversion and non-conversion counts into the Beta function along with the prior constants.
The function is expressed as: Beta(1 + Conversions, 1 + Non-Conversions)
This function yields the Posterior (a Beta Distribution) for each variant.
- Extract Random Samples: Draw 15,000 random samples from each variant’s Posterior Distribution. Each sample represents a possible value of that variant’s true conversion rate.
- Compare Samples: Compare the samples across all variants in parallel. For each set of samples (one from each variant), identify the variant with the highest value. That variant is marked as the “winner” for that iteration.
- Calculate the Probability to Be Best (P2BB):
- Count the total number of times each variant “wins” across all 15,000 iterations.
- Compute the P2BB as the percentage of wins for each variant out of the total comparisons.
The final result (P2BB value) indicates the likelihood that a variant is the top-performing version among all tested variants.
The A/B Test Leader Determination Logic
The A/B Test Leader Determination Logic is a systematic method for identifying the winning variant in an A/B test. It starts by defining clear objectives and key performance indicators (KPIs). Currently, Contentstack Personalize uses the "probability to be best" insight to determine a winning variant.
Variants are then tested on a similar audience segment, and data is collected over a set period. Statistical analysis compares each variant's performance against the control group, considering factors like statistical significance and confidence intervals. The variant that best meets the KPIs is declared the leader, enabling data-driven decisions that enhance personalization strategies.
We employ the following conditions to determine if the currently leading variant can be declared winner:
- The probability to be best of the leading variant is >= 95% AND
- At least 14 complete days have passed since the A/B Test version was first activated.
Next Steps for Winning Variants
Once the Personalize engine identifies a winning variant through its Leader Determination Logic, that content should be promoted to your Base Entry.
- Manual Method: Manually copy the content changes from the variant into the baseline entry, publish the entry, and then archive the experience.
- Automated Method: Use the ClearWinner app to automate the identification and merging of winning variants. This ensures that your production environment is updated instantly and redundant variant data is cleaned up automatically, eliminating the need for manual data entry.
For more information, refer to the Clearwinner App Installation Guide.
More articles in "Working with Experiences"
