

Analytics for AI Credits
The AI Credits analytics dashboard provides visibility into your organization’s AI usage. Use the dashboard to monitor monthly allocation, track product-wise trends, and analyze credit utilization patterns to help manage credits more effectively.
Estimated reading time: 2 minutes
Skill level: Intermediate
Prerequisites
What You Will Learn
How to access the AI Credits analytics dashboard.
How to read monthly credit allocation and usage metrics.
How to interpret product-level credit consumption in the Credits by Product table.
Access the AI Credits Analytics Dashboard
To access the analytics dashboard, log in to your Contentstack account, and perform the following steps:
- Navigate to Analytics from the “App Switcher” icon.
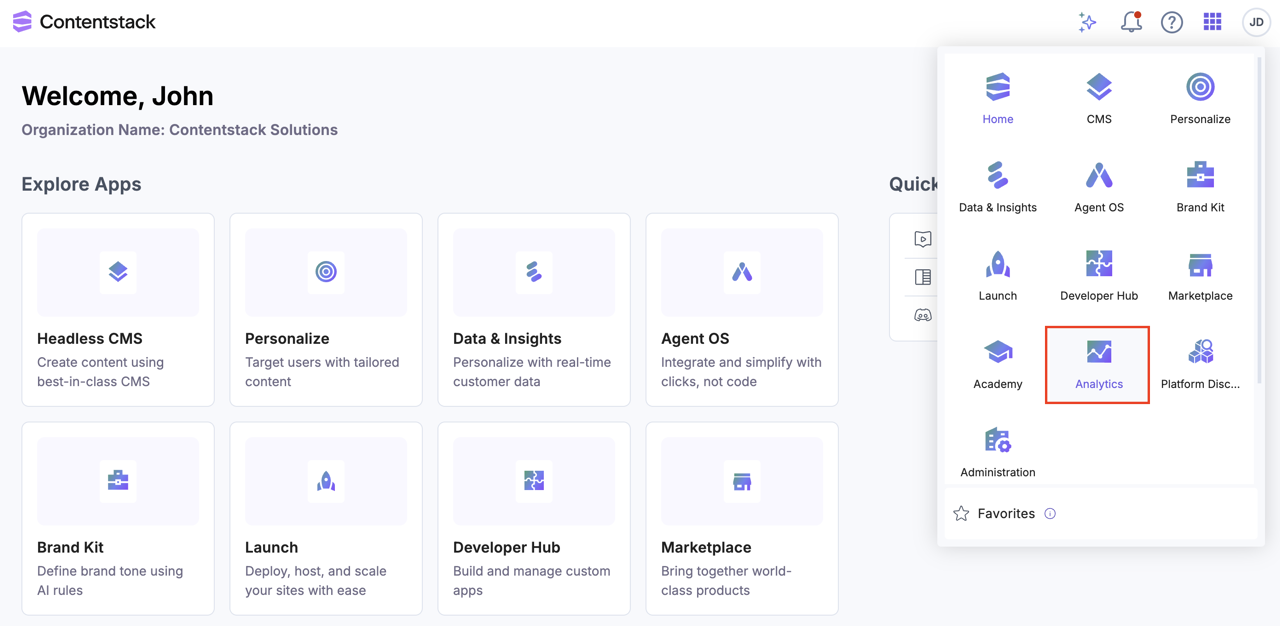
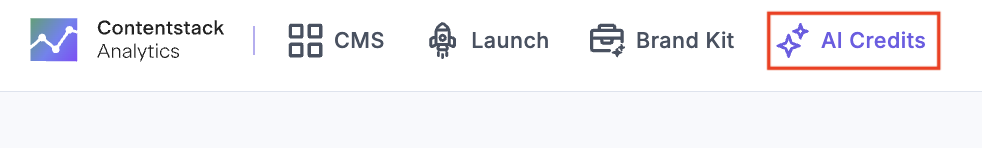
- By default, the CMS analytics dashboard appears. Click AI Credits to switch dashboards.
Note: All credit balances reset on the 1st of every month.
AI Credits Analytics Dashboard Sections
The AI Credits analytics dashboard is divided into multiple sections that provide high-level allocation insights and detailed product-wise usage analytics.
Monthly Credit Usage
This section provides an overview of your organization’s credit allocation and usage for the current month.
- Credits Used and Remaining: Displays total credits consumed.
- Excess Credits Limit Used and Remaining: Tracks usage beyond the allocation applied against the configured Credits Limit. For details on configuring credit limits, refer AI Credits Management.
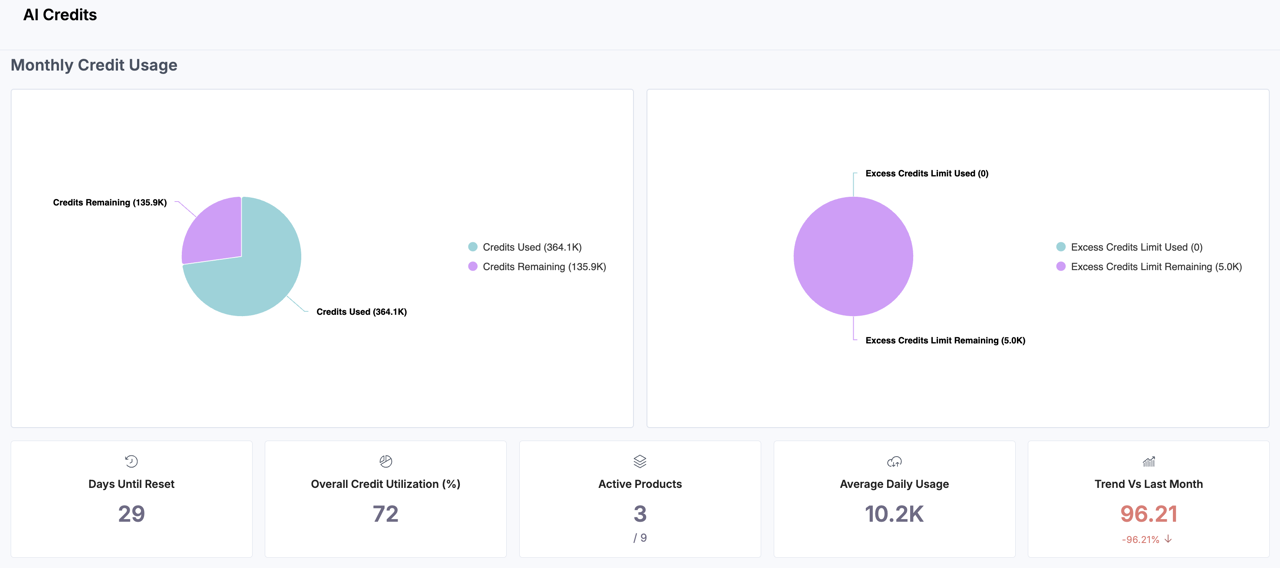
The following metric blocks offer a quick summary of your organization’s credit health:
- Days Until Reset: Number of days remaining until your monthly allocation refreshes.
- Overall Credit Utilization (%): Holds the total credit consumption.
- Active Products: Total number of AI-enabled products currently consuming credits.
- Average Daily Usage: The average credits consumed per day during the selected period.
- Trend Vs Last Month: Compare the trend with the last month's consumption.
Tip: Use these charts to monitor whether your organization is approaching the Excess Usage or requires adjustment.
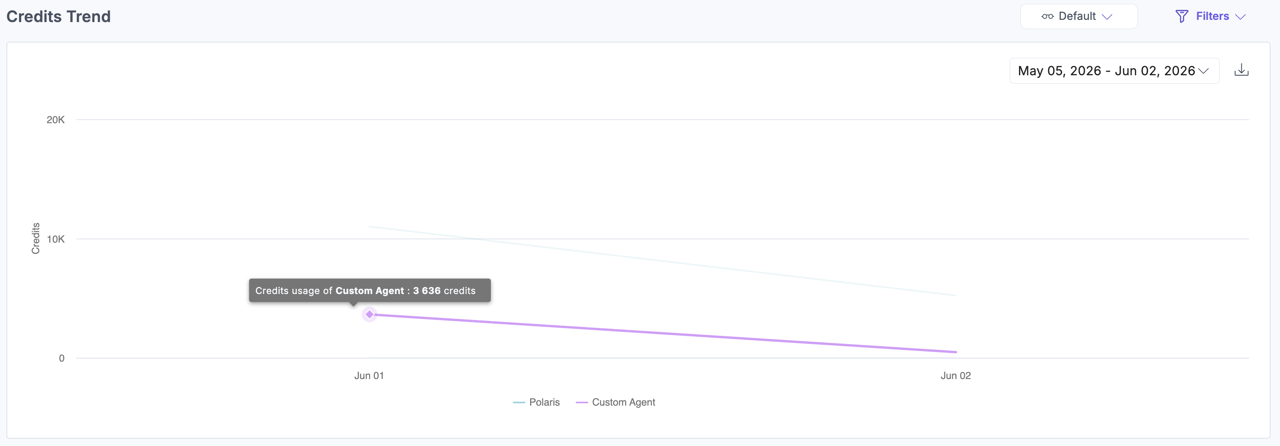
Credits Trend
This section displays a time-series area chart that tracks daily credit usage trends across products. Hover over the chart data points to view product-wise usage details for a selected day.
Credits by Product
This table provides a detailed breakdown of credit usage by product:
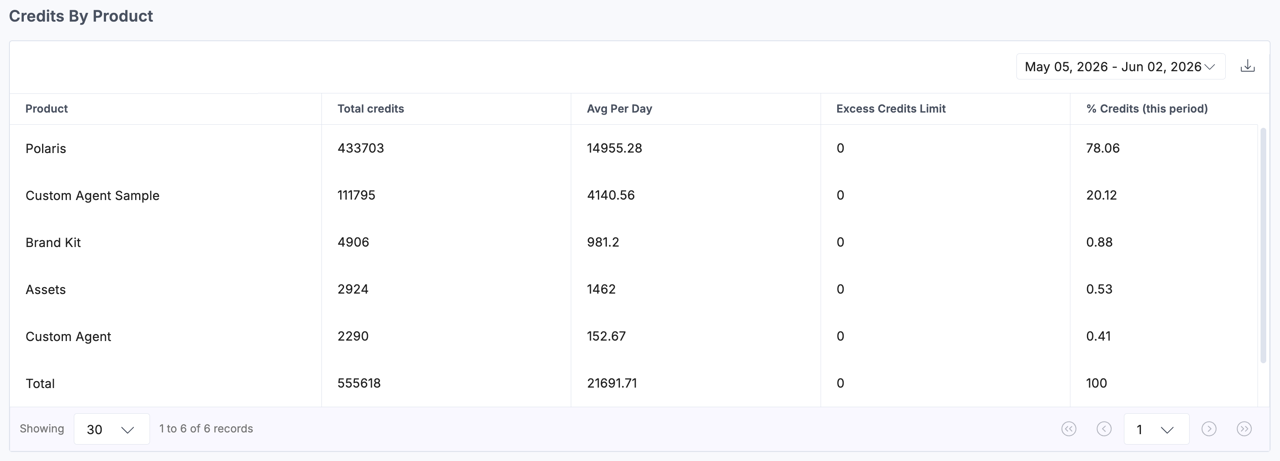
- Product Name: The name of the AI-enabled product (for example, Agent OS)
- Total Credits: Total credits consumed during the selected period.
- Average Per Day: The average credits consumed daily by the product.
- Excess Credits Limit: Credits consumed after the monthly credit allocation was exhausted.
- % Credits (this period): The total credits consumed in percentage for the selected timeline.
Related Resources
More articles in "Work with Analytics"
