

View Execution Log of Agent OS
The Execution Log section in Agent OS helps you monitor the status of your automations and agents.
Additional Resource: Refer to the Executions in Agent OS documentation to learn about the execution statuses.
To access Execution Log, log into your Contentstack account and perform the following steps:
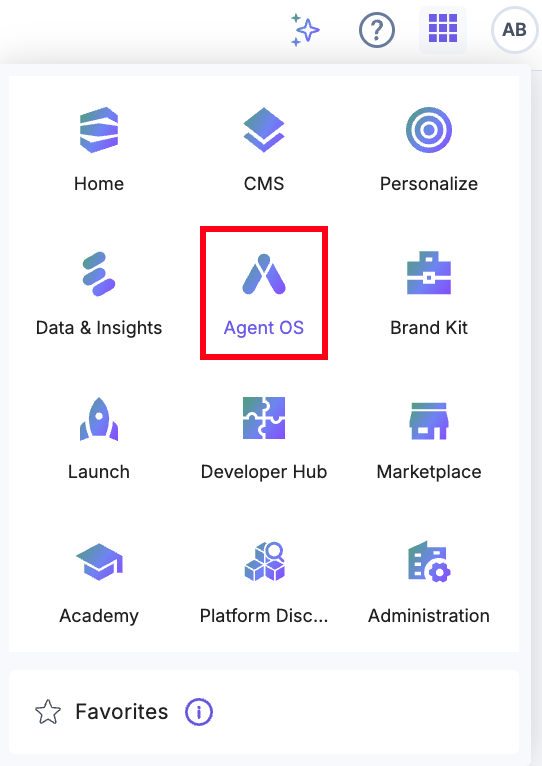
- After logging in, click the App Switcher icon, then select Agent OS from the list.
- Open your project or create a new one.
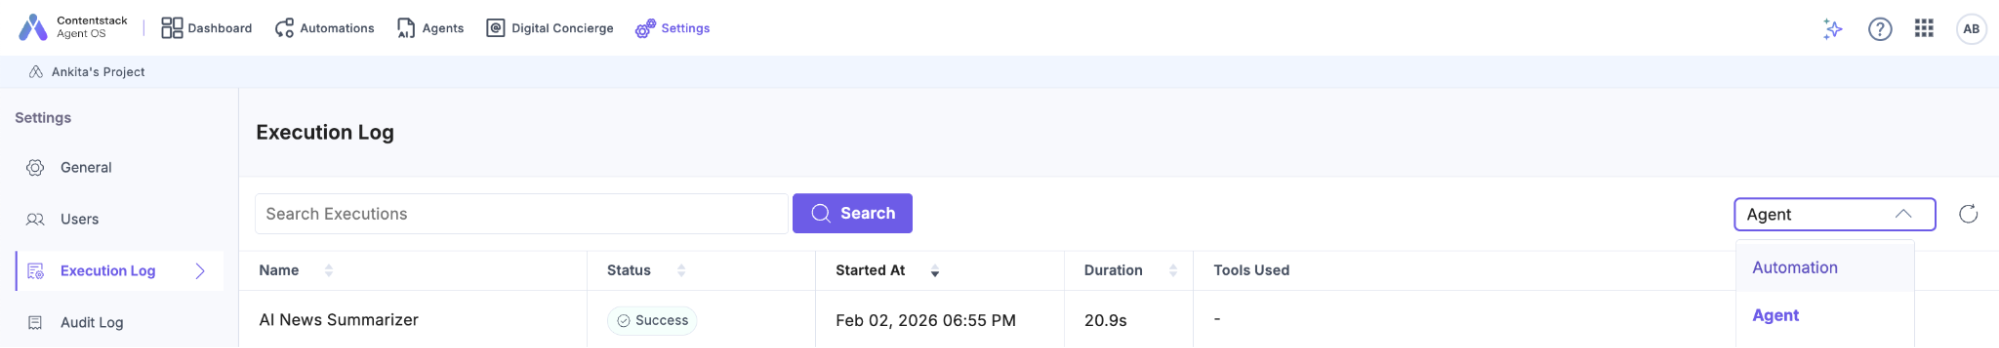
- From the top navigation panel, click Settings.

- Click Execution Log in the left navigation panel. You can view the executions for Agents and Automations by clicking the dropdown.
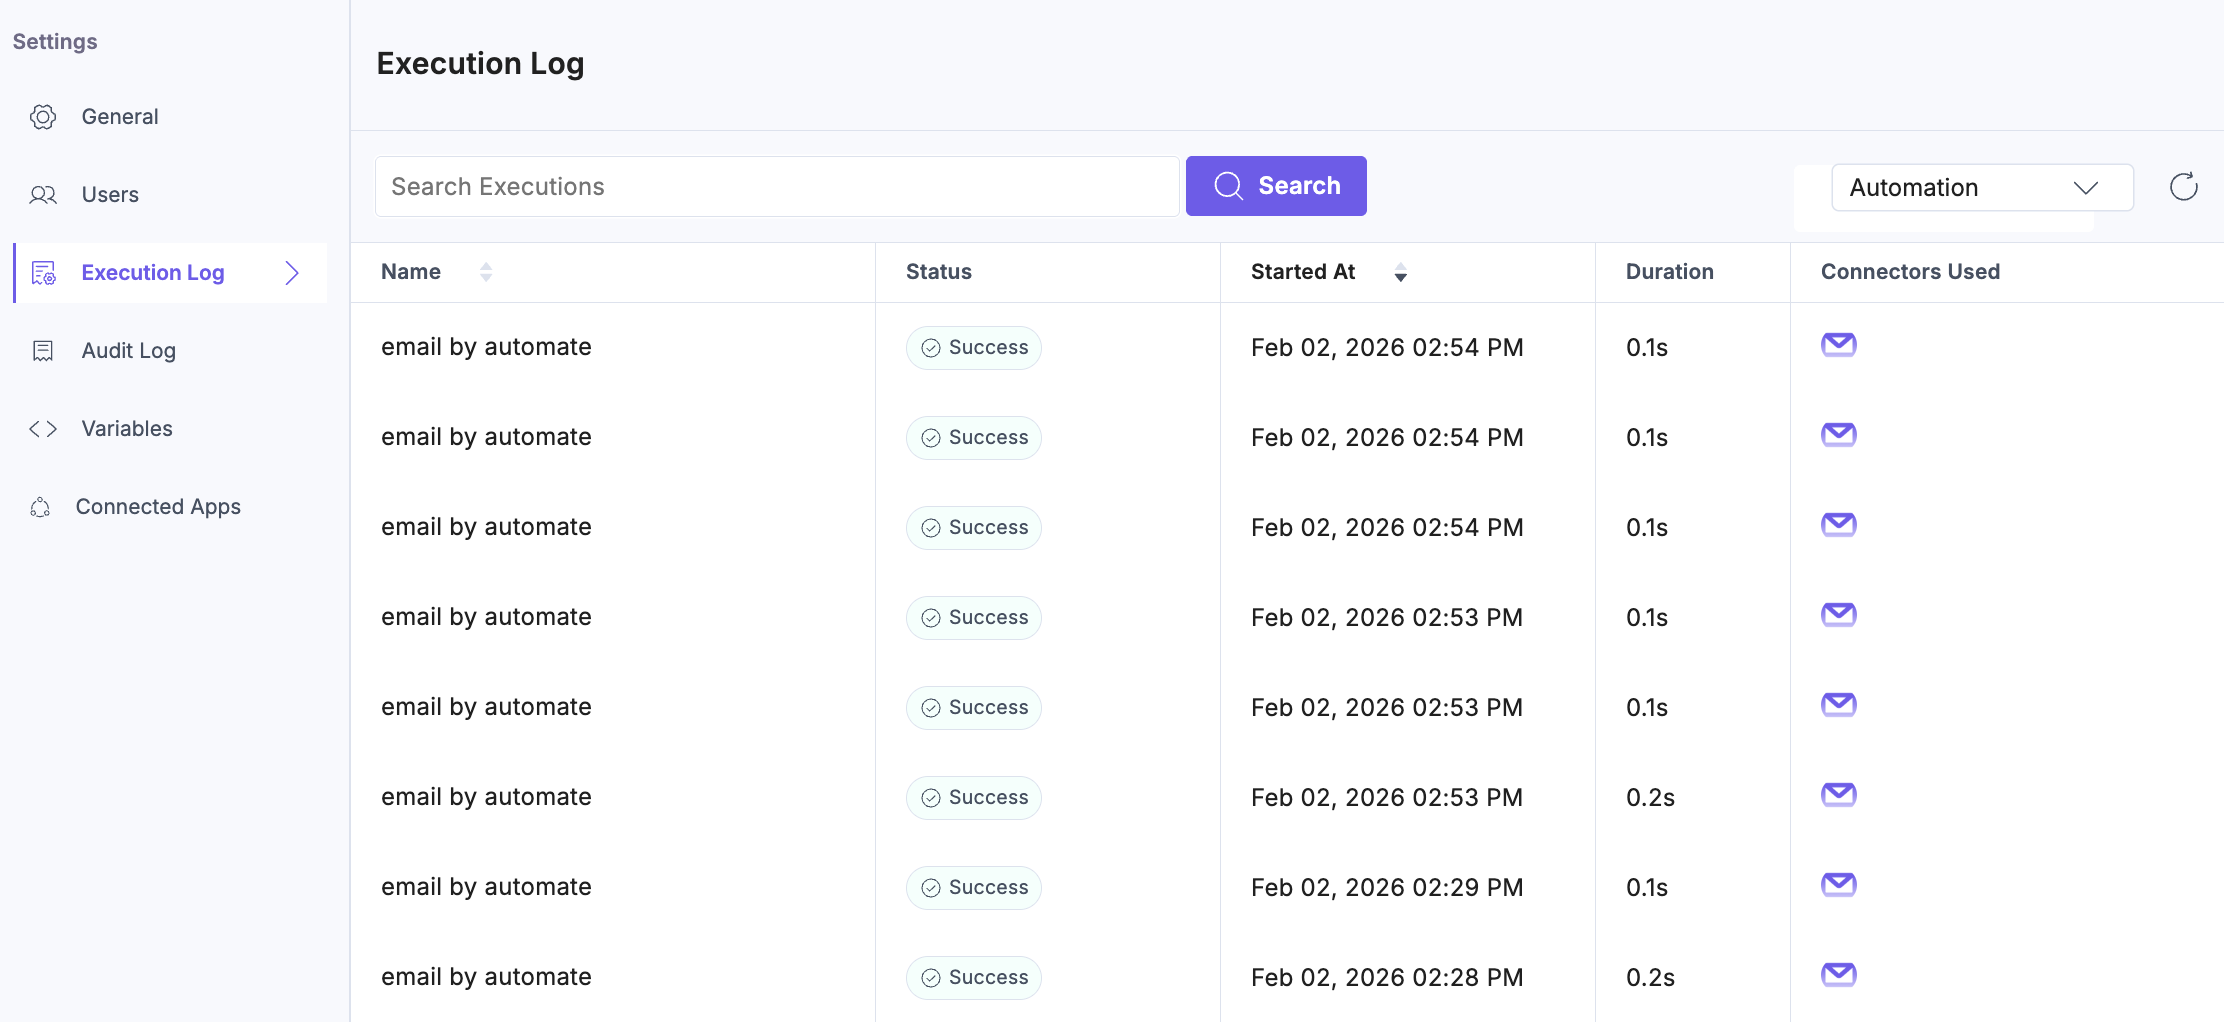
On the listing page, you see the following columns:
- Name: Displays the name of the automation or agent that was executed.
- Status: Shows the final execution state (e.g., Success or Failed) or intermediate states (Running, Pending, Paused, and Rejected).
- Started At: Indicates the date and time when the execution began.
- Duration: Shows how long the execution took to complete.
- Connectors Used: Indicates which connectors or services were used during the execution.
- Tools Used: Indicates the tools used during the agent execution.
Note: To view the log, you must execute an automation or agent.
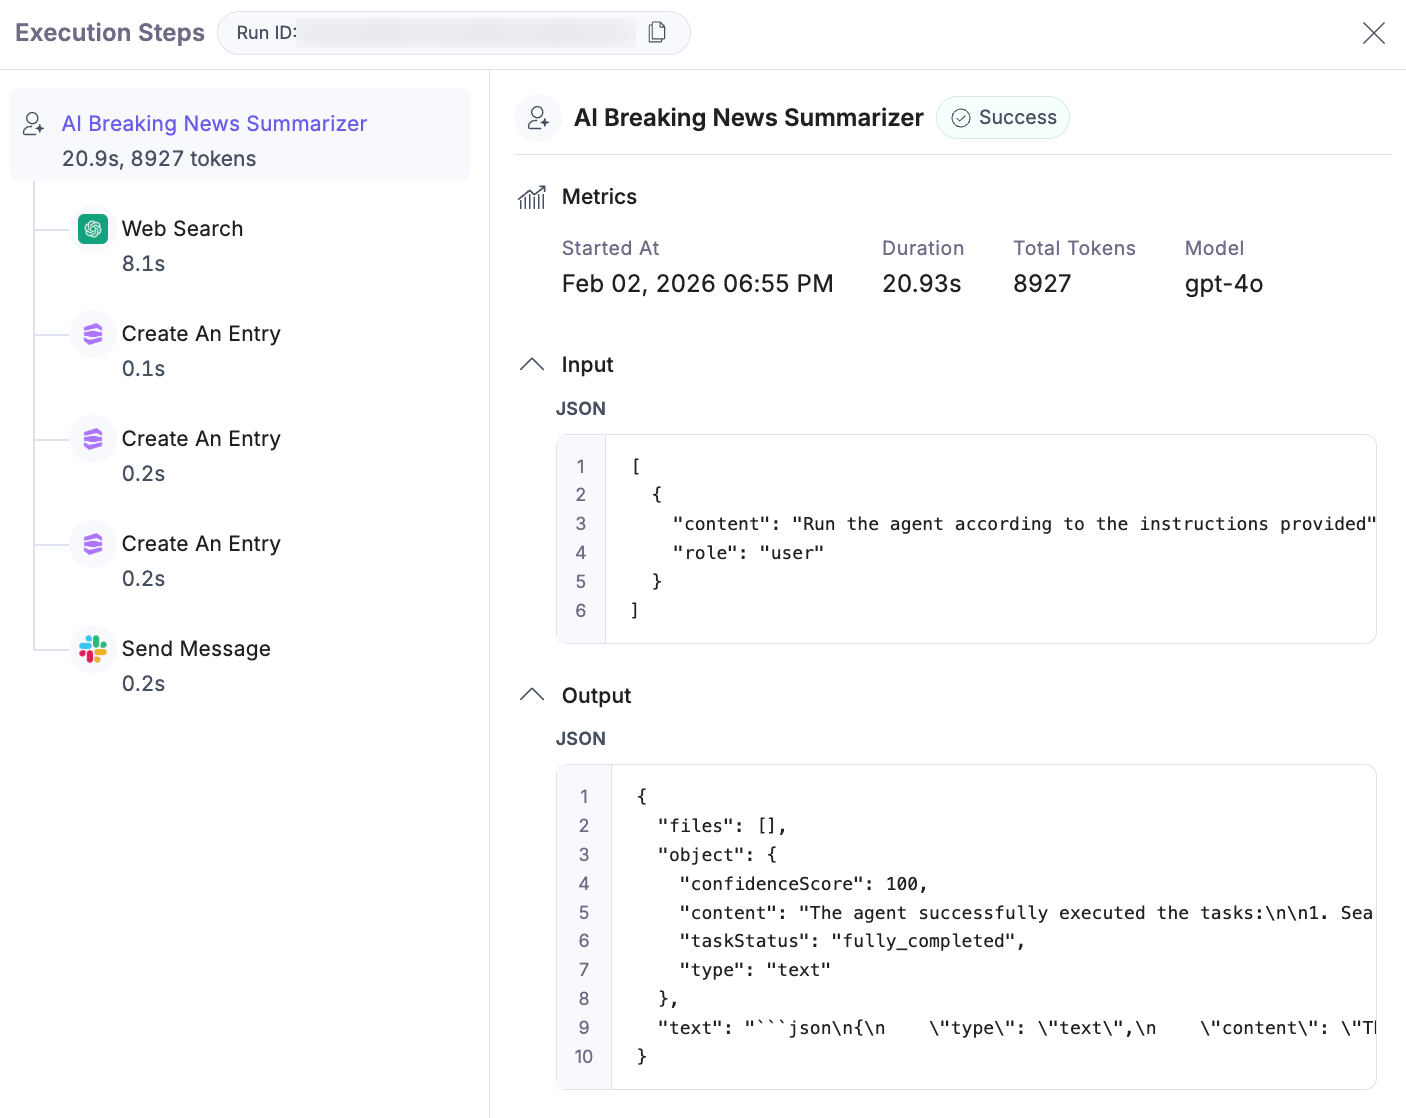
To view more details of a particular execution, click a specific log. You will see a time-wise distribution of each step.
Execution steps
The Execution Steps timeline shows every action performed during the run in chronological order, making it easy to trace agent behavior and identify performance bottlenecks.
Agent execution detail includes:
- Step-by-step execution flow (for example, web search, content creation, message delivery)
- Metrics:
- Started At: Shows the exact date and time when the execution began.
- Duration: Indicates how long the execution took to complete from start to finish.
- Total Tokens: Represents the total number of tokens consumed during the run, helping track usage and cost.
- Model: Identifies the AI model used to execute the task.
- Input and Output:
- Input:
- Displays the exact prompt or instructions provided to the agent.
- Shown in JSON format for reproducibility.
- Output:
- Displays structured execution results in JSON format.
- Input:
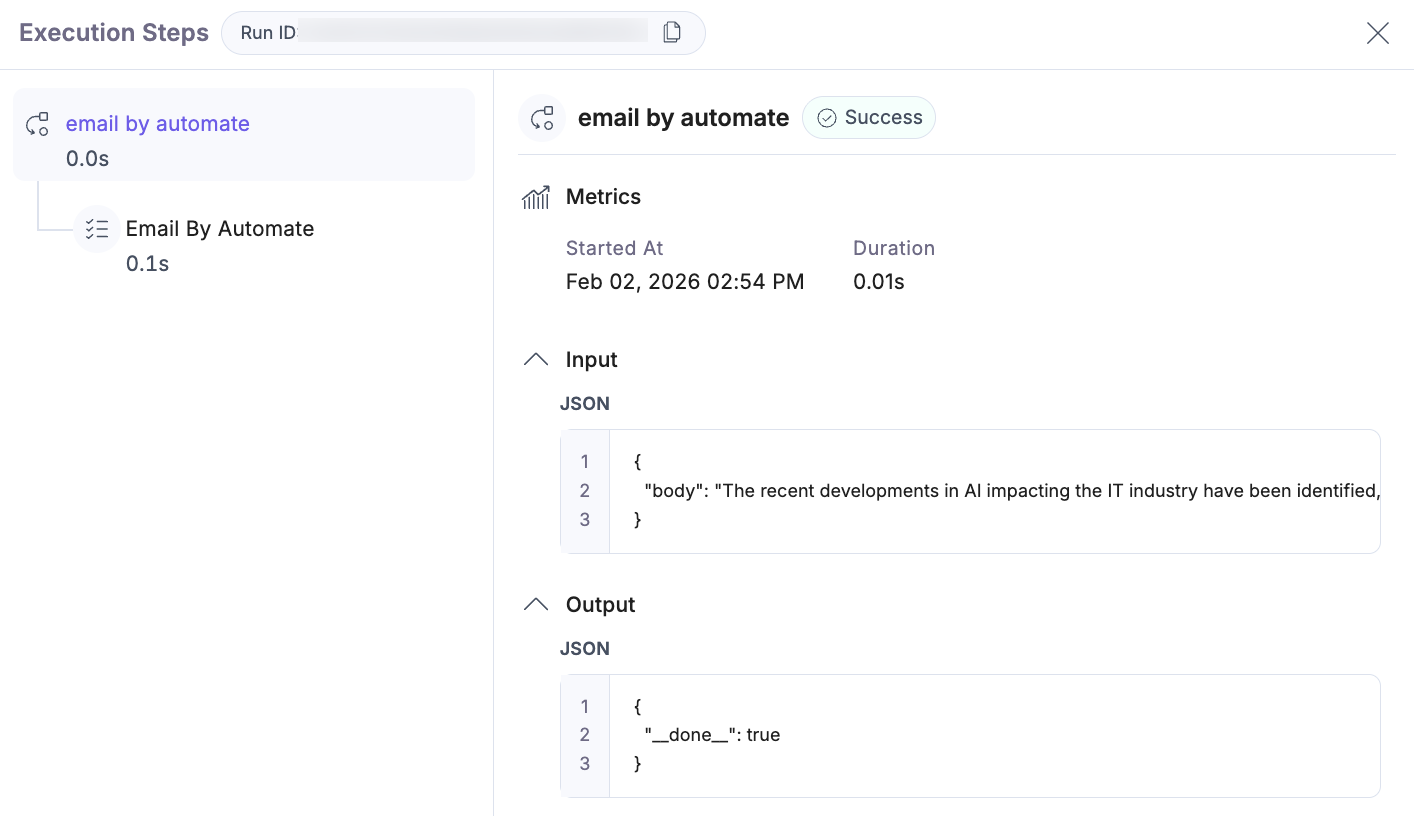
Automation execution detail includes:
- Step-by-step execution flow (for example, web search, content creation, message delivery)
- Metrics:
- Started At: Shows the exact date and time when the execution began.
- Duration: Indicates how long the execution took to complete from start to finish.
- Input and Output:
- Input:
- Displays the trigger payload or initial input data/configuration for the automation.
- Shown in JSON format for reproducibility.
- Output:
- Displays structured execution results in JSON format.
- Input:
