

Healthcheck App Installation Guide
The Healthcheck app is an examining tool that provides a comprehensive view of your stack's health and performance. Its insights and tracking of key metrics, such as security vulnerabilities, publishing workflows, and content operations, alert you to any issues or bottlenecks.
By installing the Healthcheck app from the Contentstack Marketplace, you can easily analyze the health and performance of your stacks in Contentstack.
Note: The Healthcheck app supports up to 100,000 entries.
Prerequisites
- Contentstack account
- Access to the Contentstack Organization/Stack as the Owner/Admin
- Full Page UI Location
Let's follow the step-by-step guide to install and configure the Healthcheck app within your stack.
Steps for Execution
Install and Configure the Healthcheck App in Marketplace
To install this app, log in to your Contentstack account and follow the steps below:
- Navigate to the “App Switcher” icon in the top-right corner and click Marketplace.
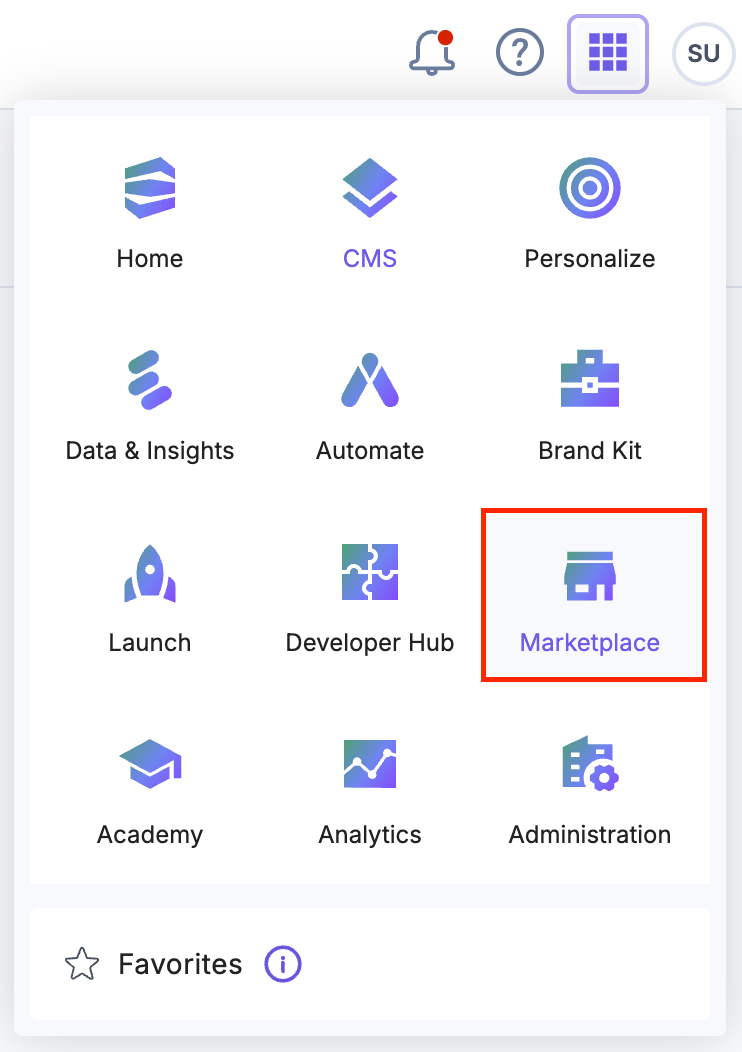
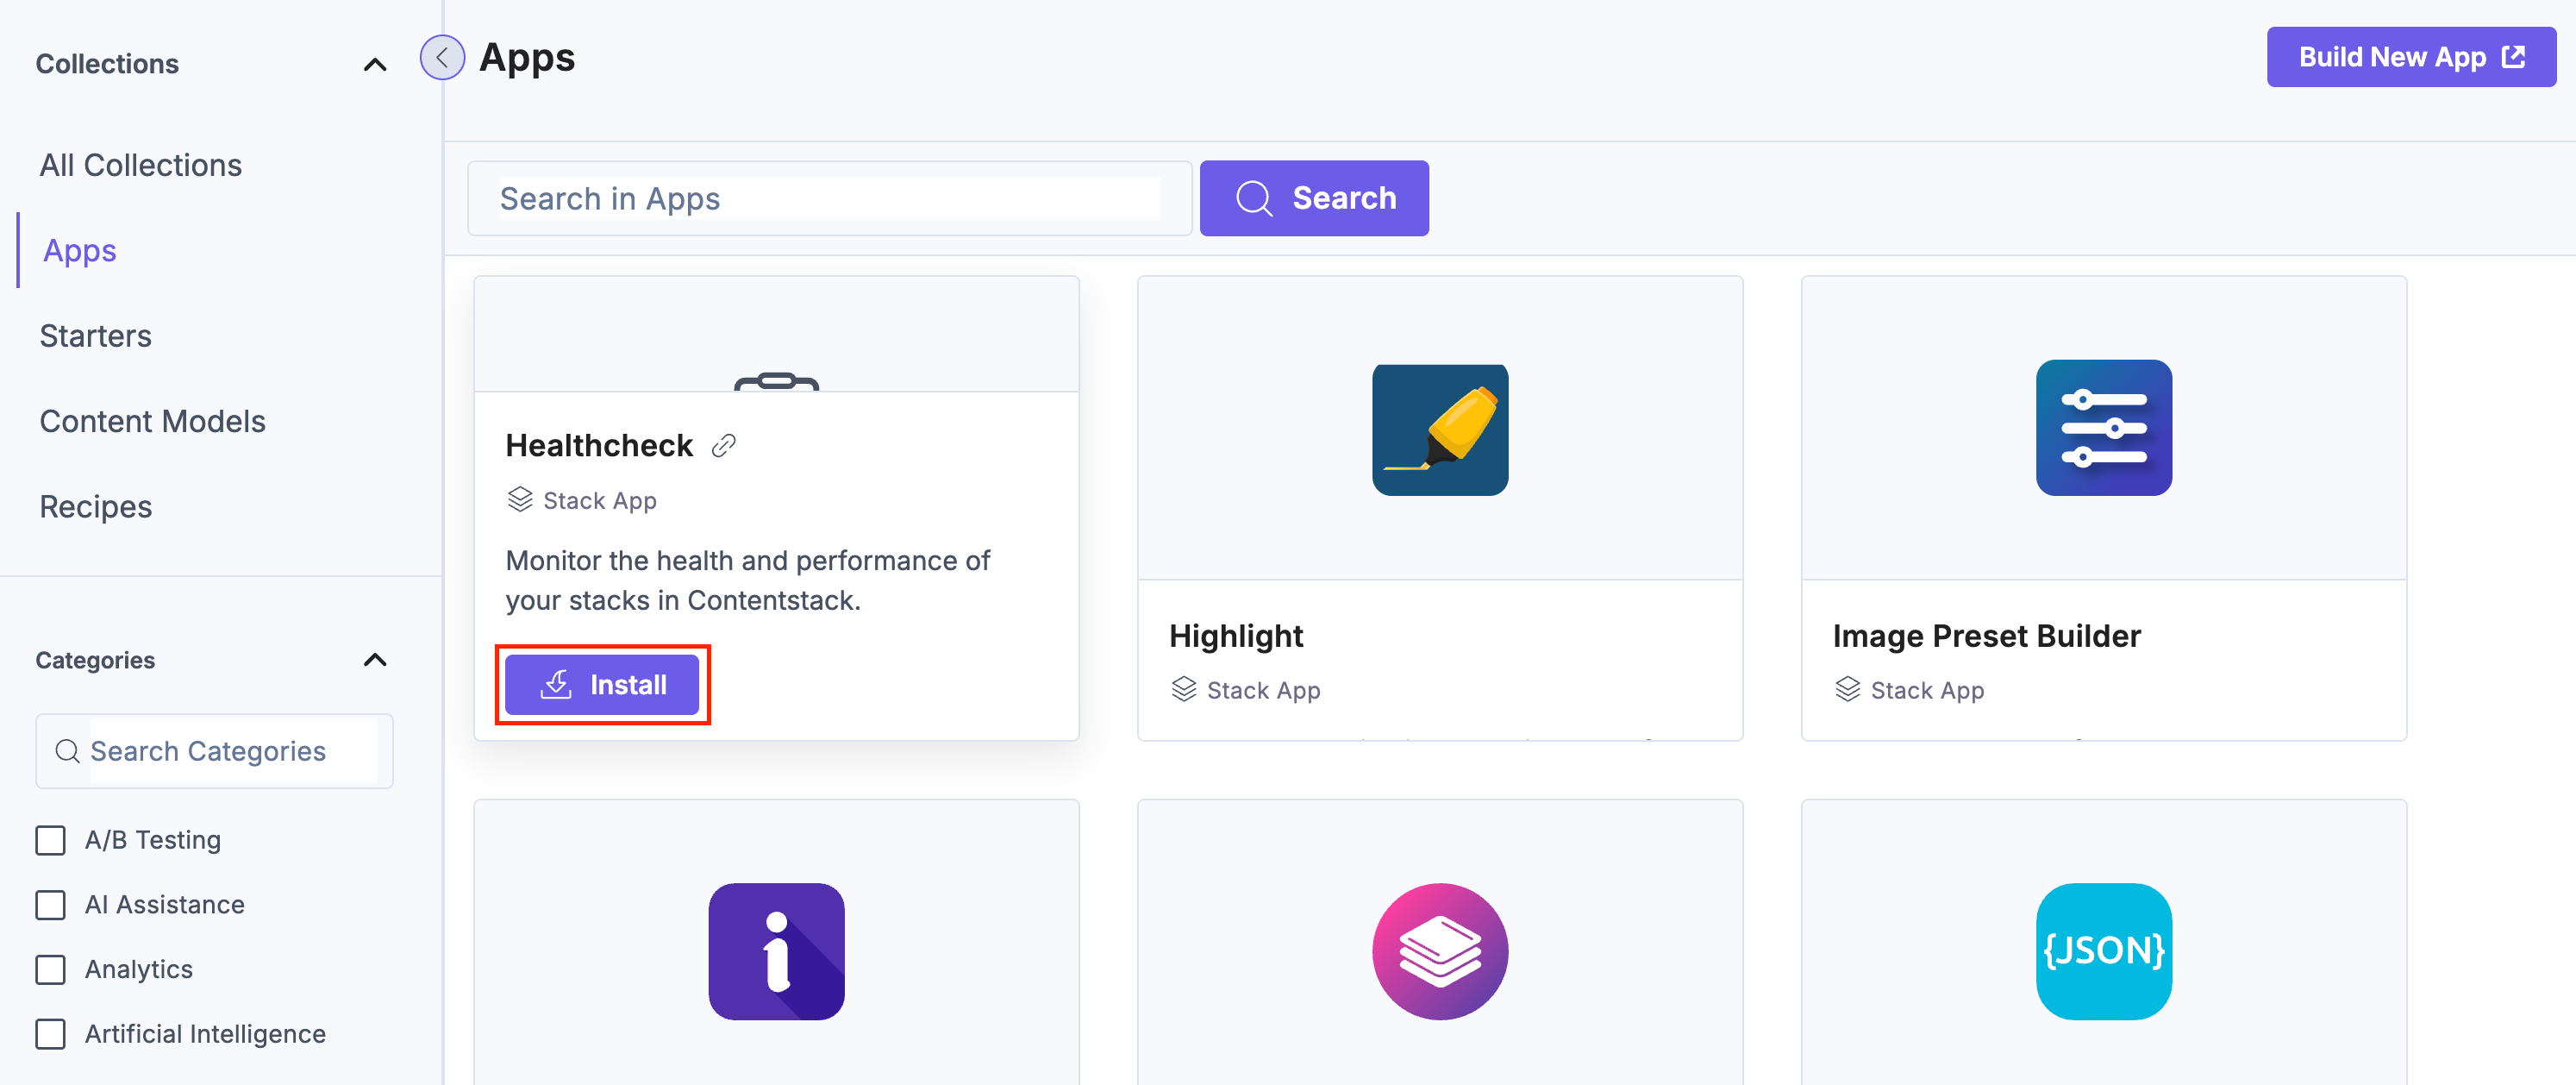
- Click Apps from the left panel.
- Within the Marketplace, you can see the available apps. Hover over the Healthcheck app and click Install.
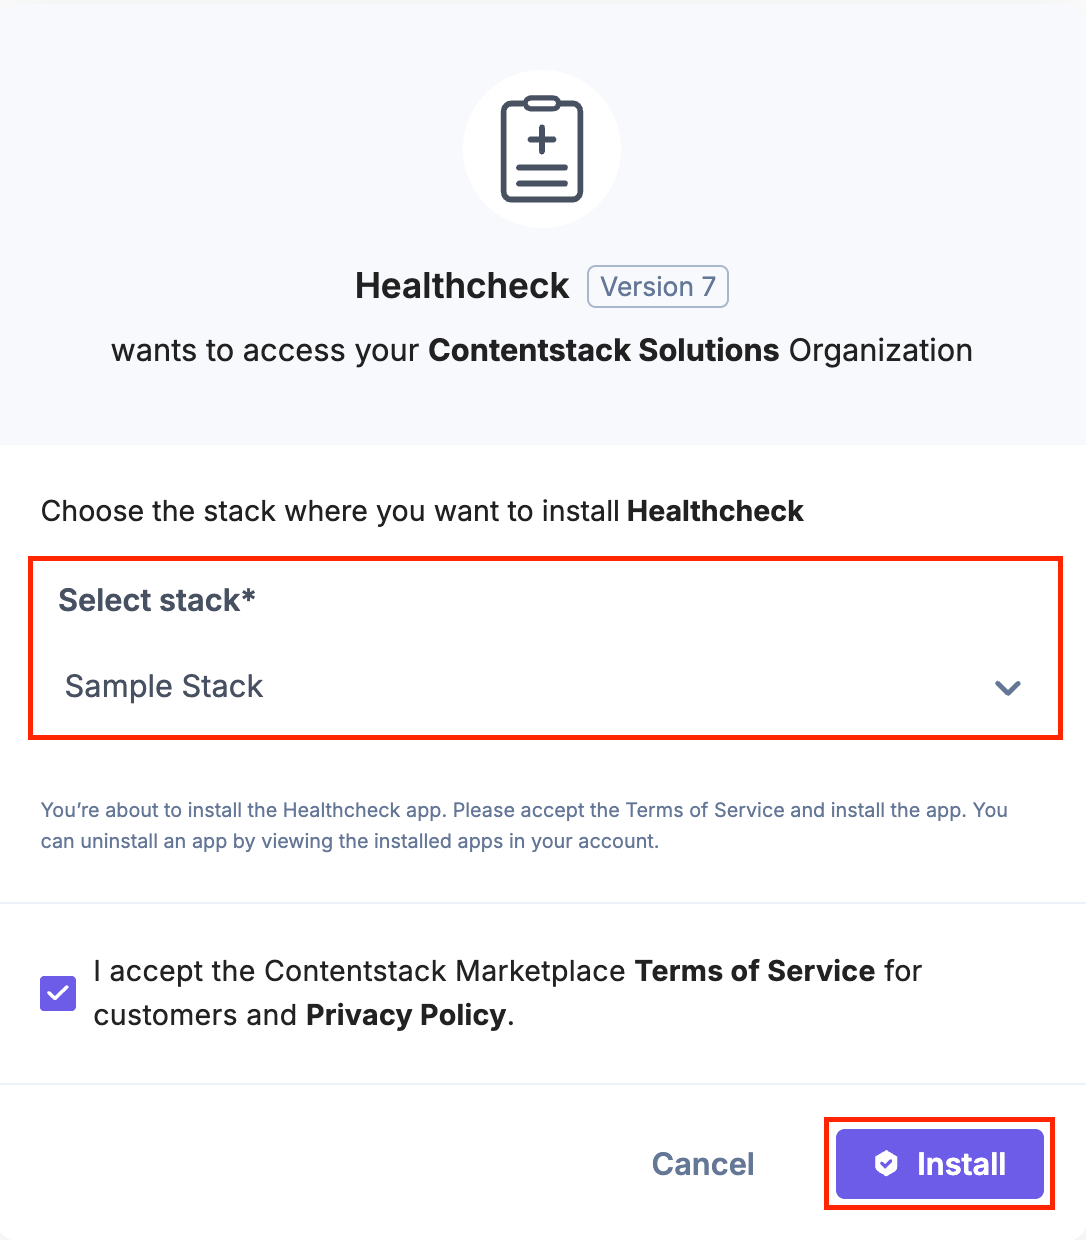
- In the pop-up window, select the stack where you want to install the Healthcheck app, accept the Terms of Service, and click the Install button.
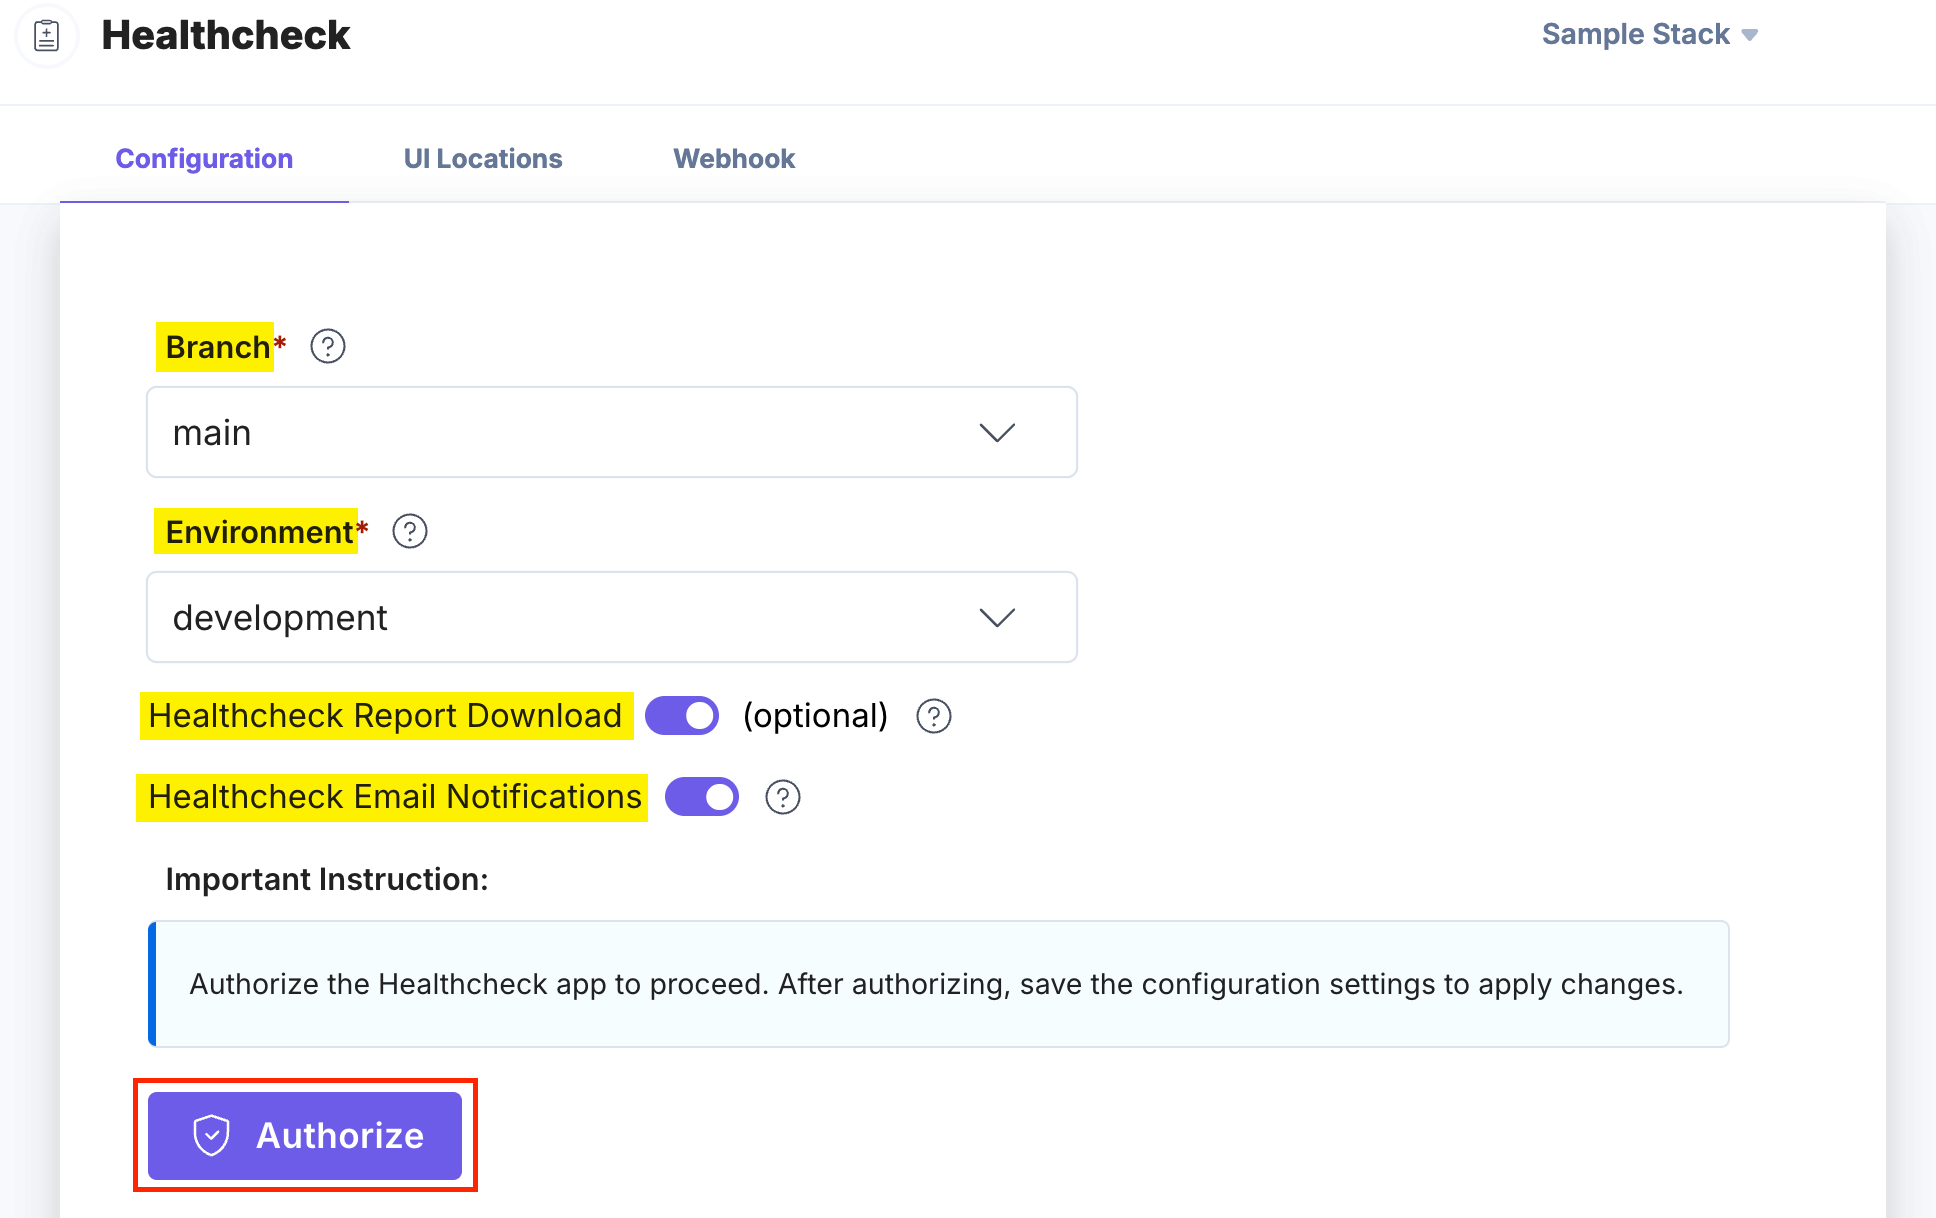
- On the Configuration screen, perform the following steps:
- Select the Branch and Environment from their respective drop-down menus.
- Enable the Healthcheck Report Download toggle to allow users to download health check reports using the Download PDF button on the Overview page.
Note: Disabling this setting will also disable the Download PDF button.
- Enable the Healthcheck Email Notifications toggle to send email notifications when required.
- After configuring the settings, click Authorize.
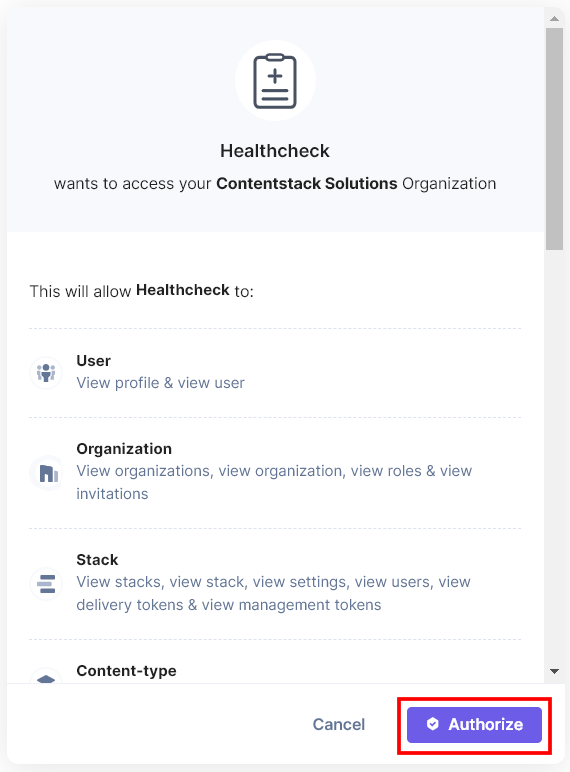
- The app displays the organization's entities. Scroll down and click the Authorize button again to complete the OAuth authorization.
Additional Resource: For more information, refer to the Branches, Environments, and Contentstack OAuth documentation.
- Click the Save button to save the configuration.
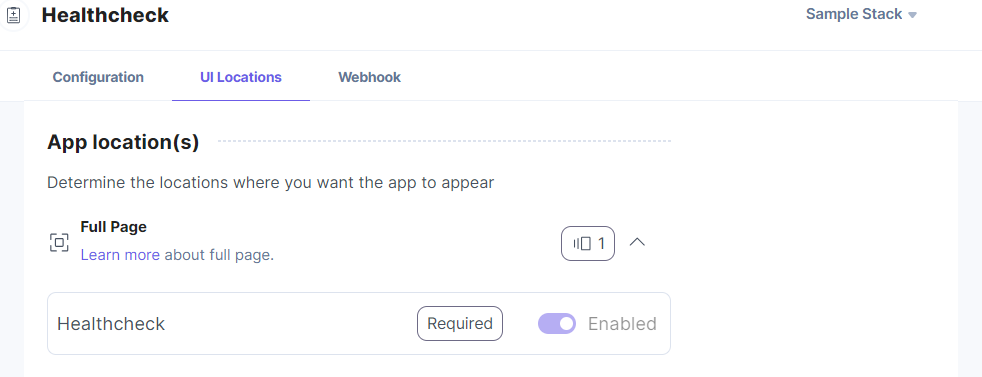
- On the UI Locations tab, you can see the predefined app location. As the Healthcheck app is a Full Page Location app, the only UI location available is Full Page, as shown below.
Additional Resource: For more information, refer to the Full Page Location documentation.
- If the webhook is enabled for your app, you can view the webhook logs under the Webhook tab.
Additional Resource: For more information, on UI locations and webhooks, refer to the Installed Apps guide.
- Click Open Stack to start using the Healthcheck app.
- Navigate to the “App Switcher” icon in the top-right corner and click Marketplace.
Use the Healthcheck App within your Stack
To use the Healthcheck app in your stack, log in to your Contentstack account and follow the steps below:
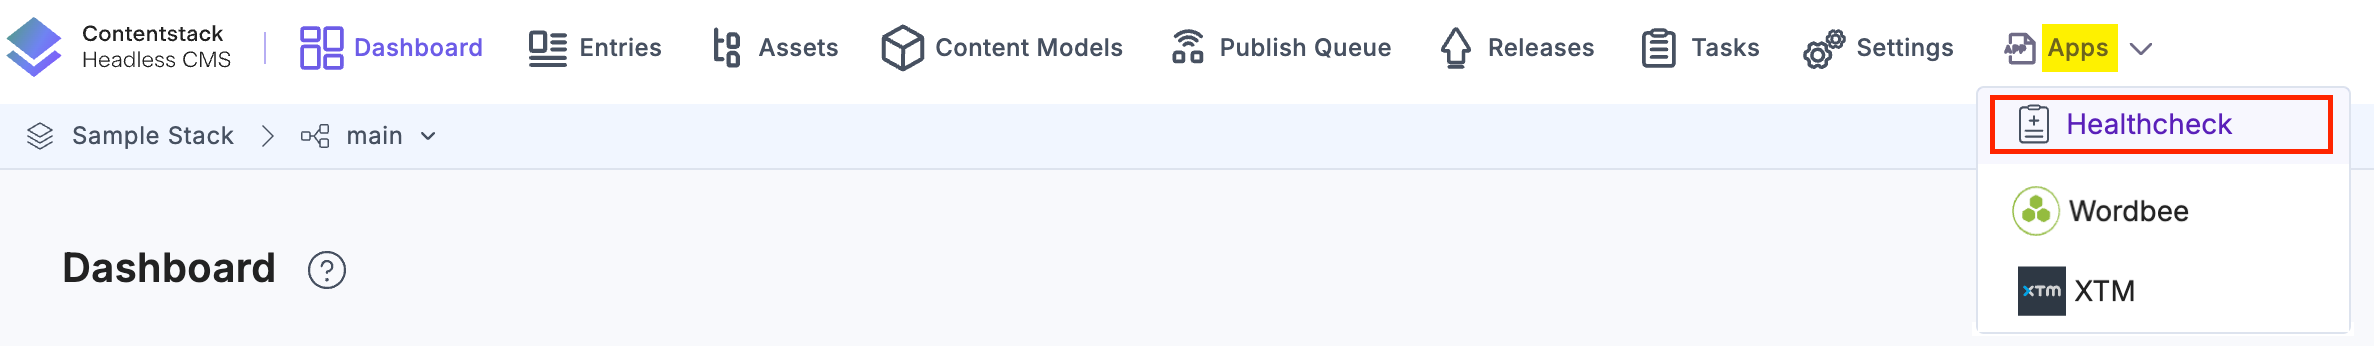
- Navigate to the stack dashboard, click Apps from the header, and select the Healthcheck app.
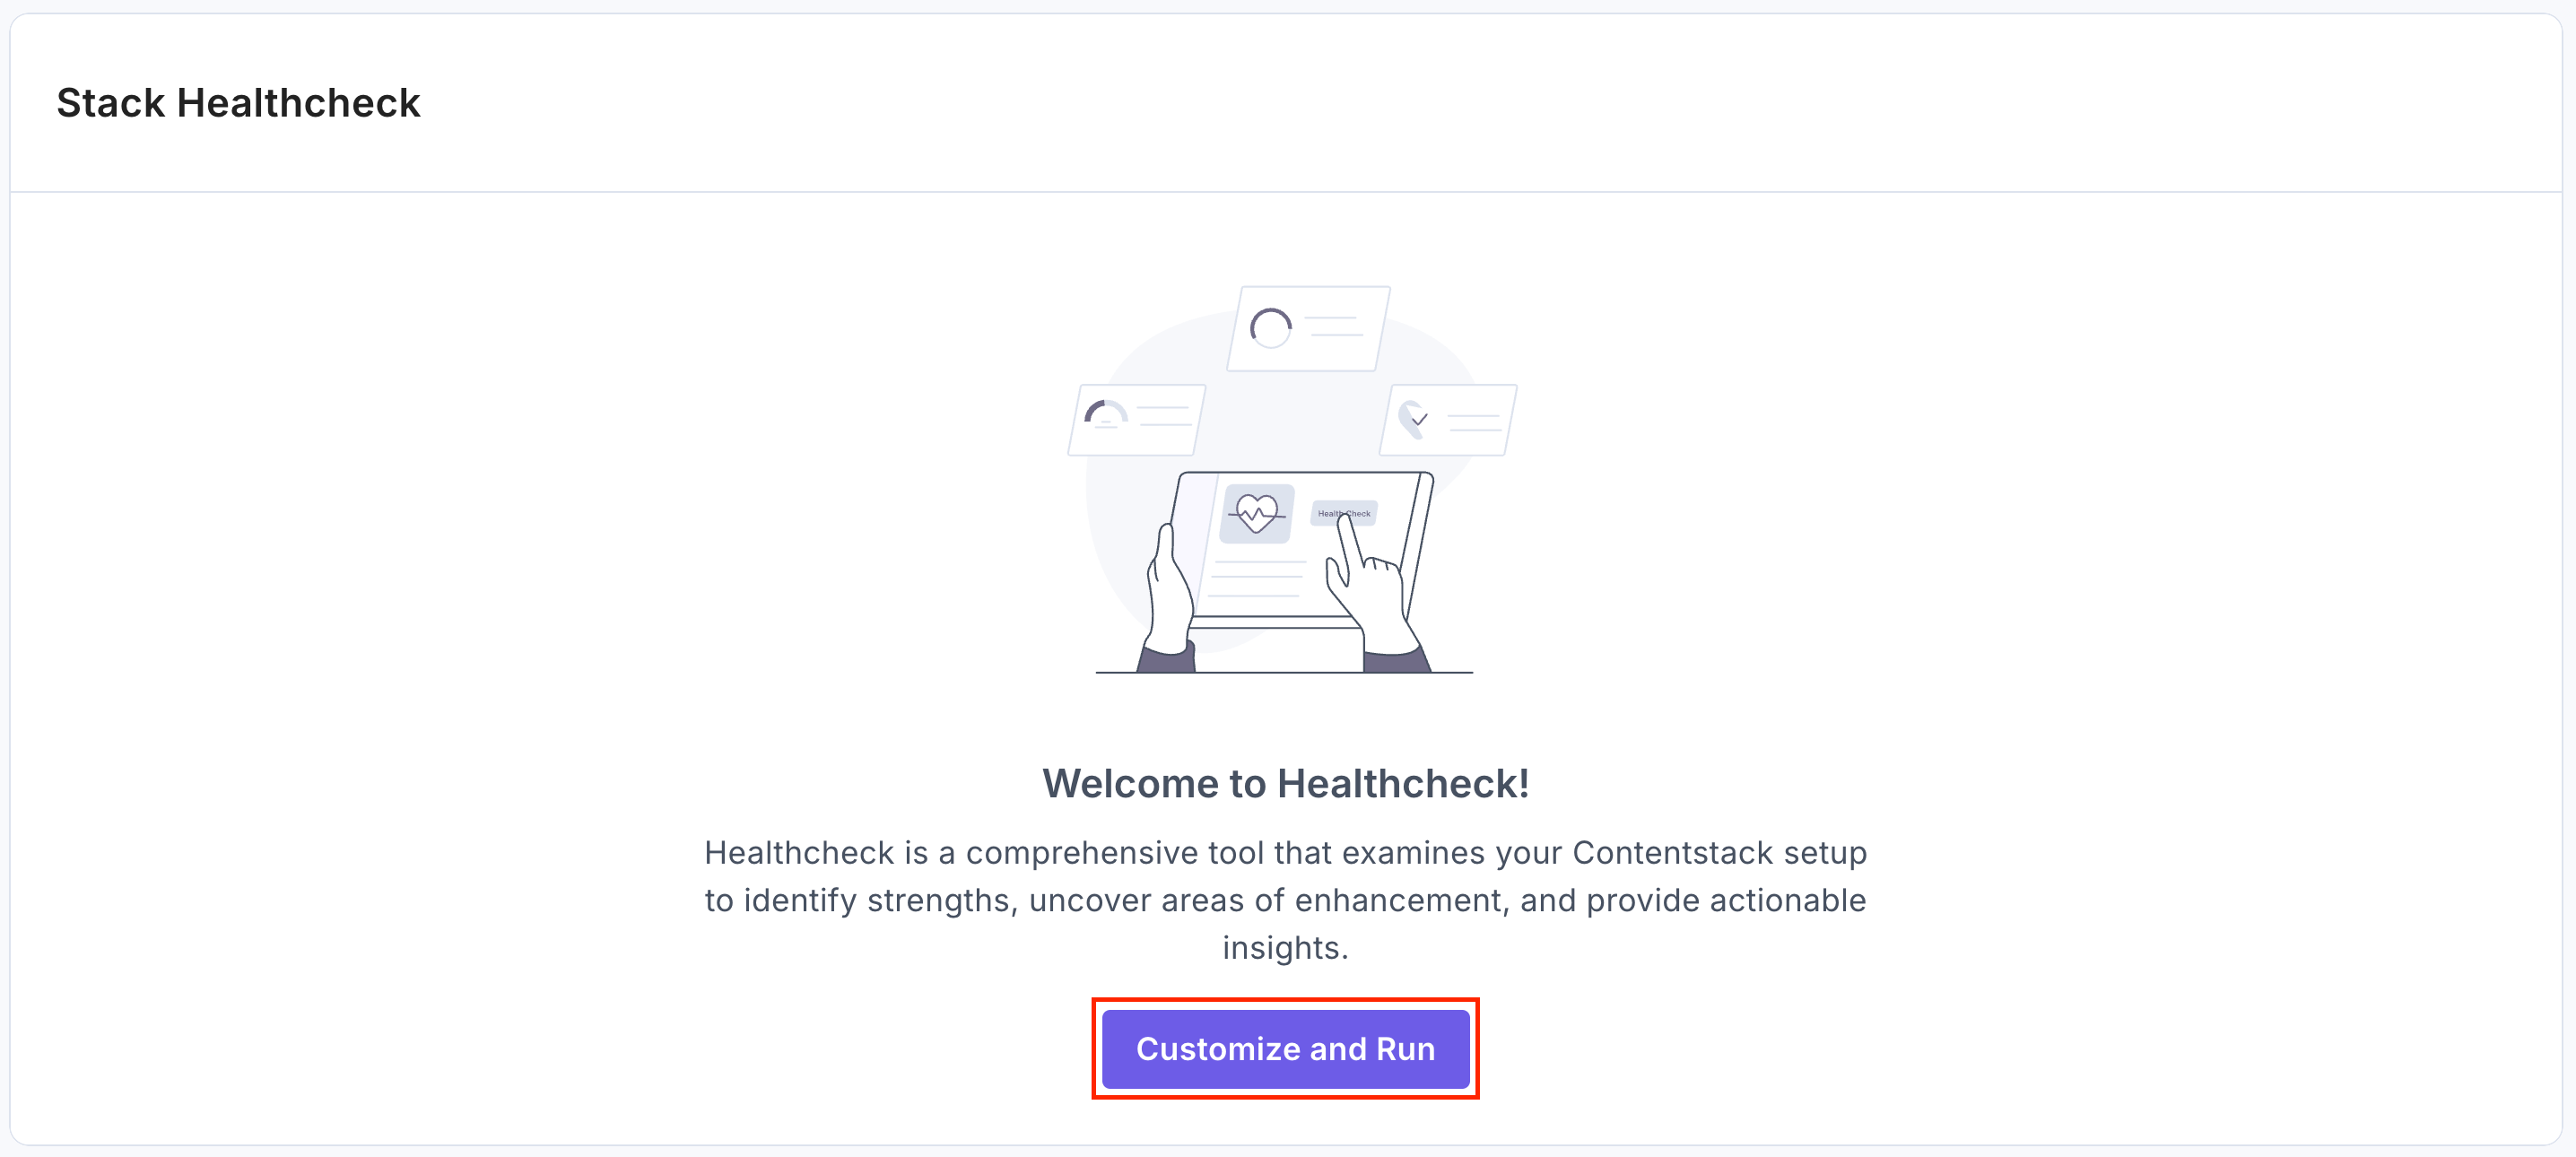
- You can view the Healthcheck app within your CMS. To check the health of your stack using the Healthcheck app, click Customize and Run.
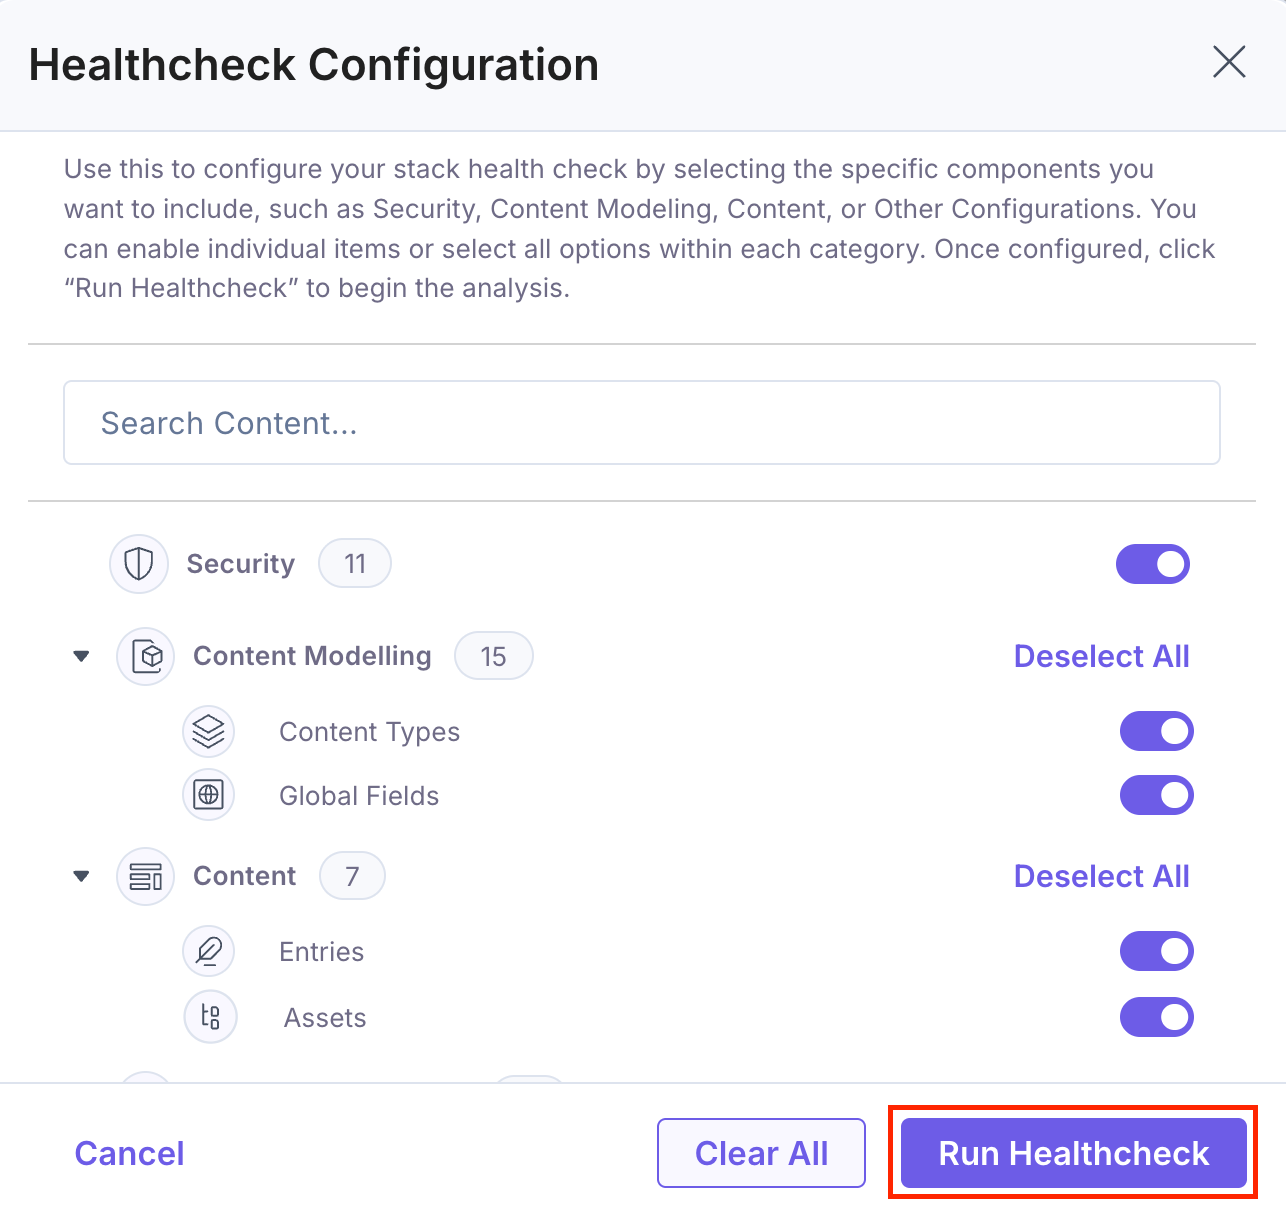
- In the Healthcheck Configuration modal, all relevant checks are pre-selected by default. You can enable or disable individual items or the entire category, then click Run Healthcheck again to begin the analysis.
Click the Clear All button to disable and reset all selections.
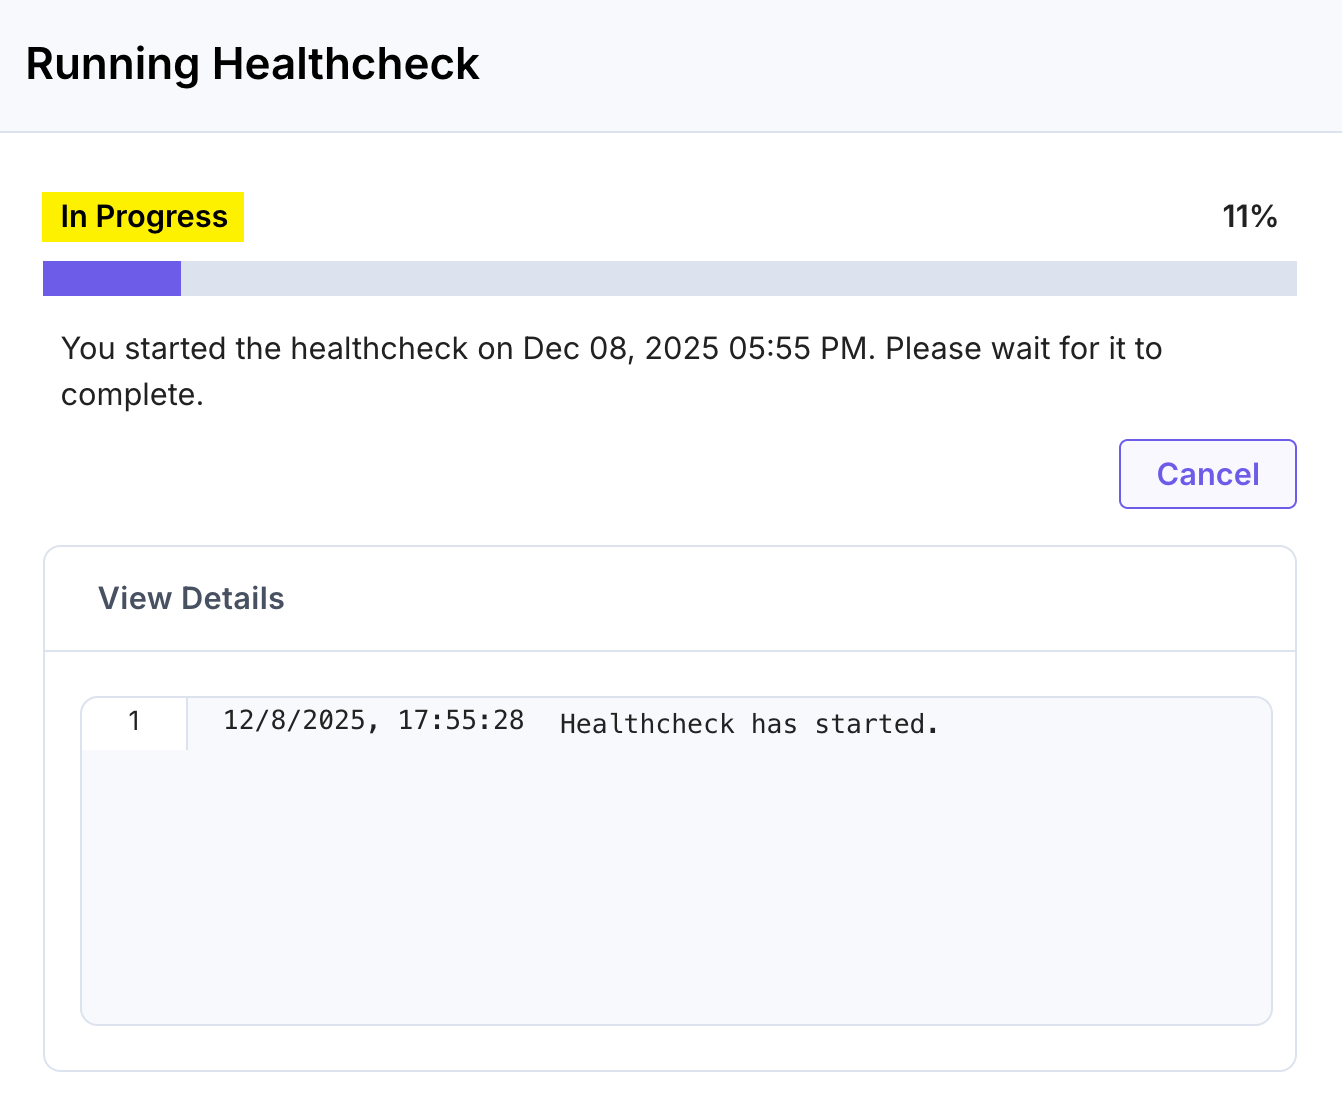
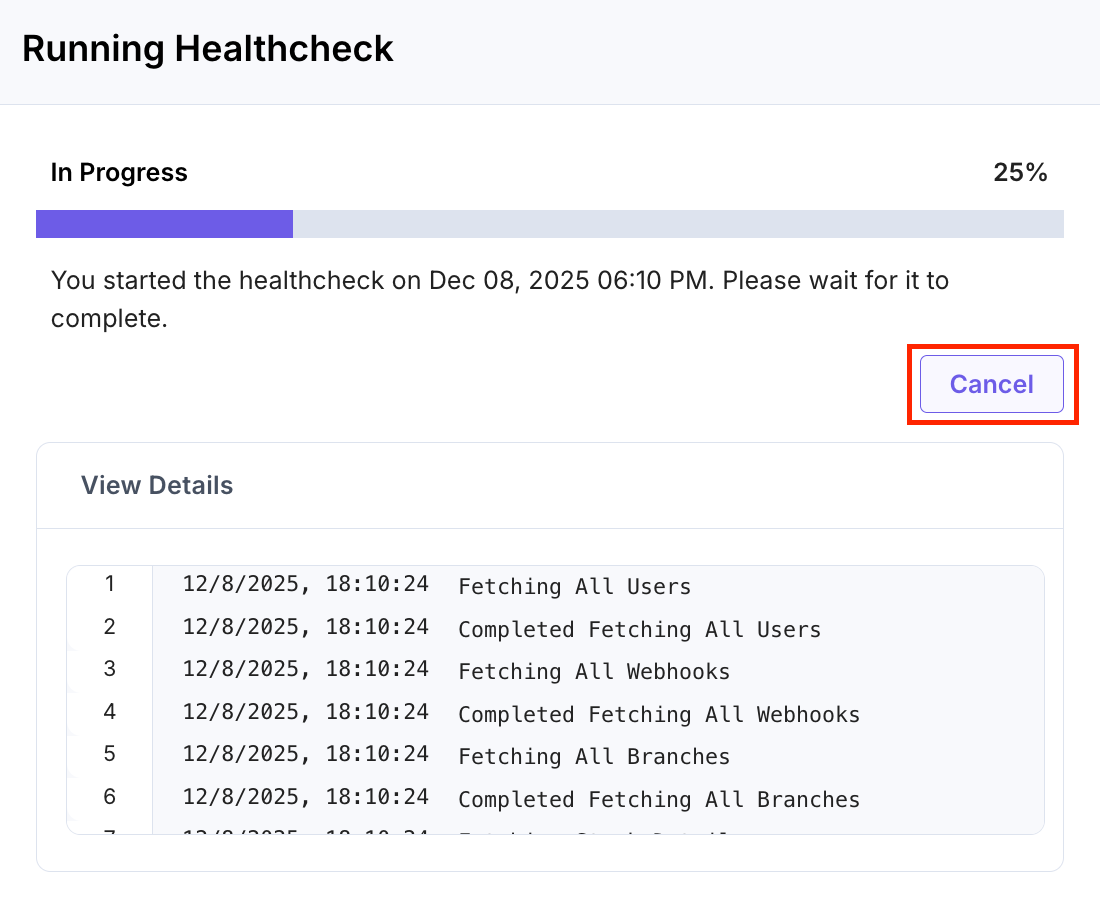
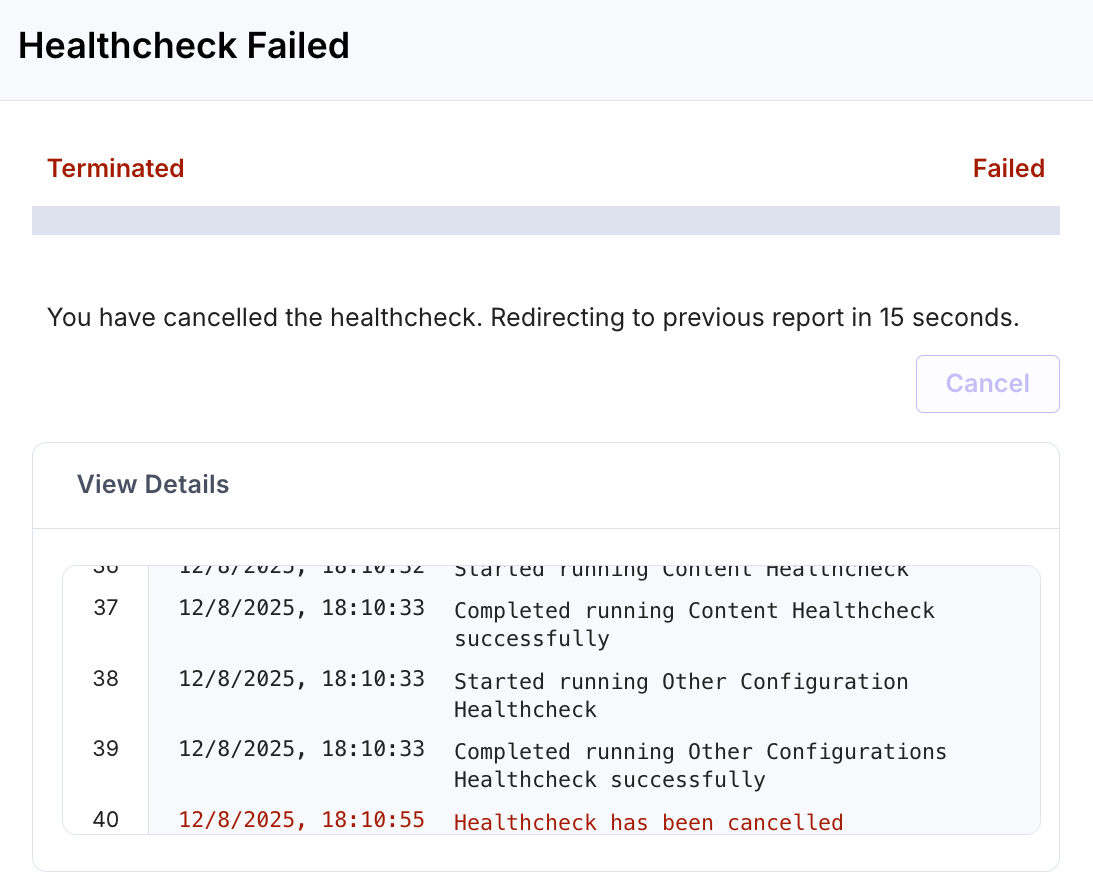
- You can view the health check progress in the Running Healthcheck modal. It displays a progress bar, a timestamp, a View Details section with real-time logs, and the Cancel button.
If you want to stop the healthcheck run, click Cancel.
A confirmation dialog appears. Click Yes to cancel the check, or No to keep it running.
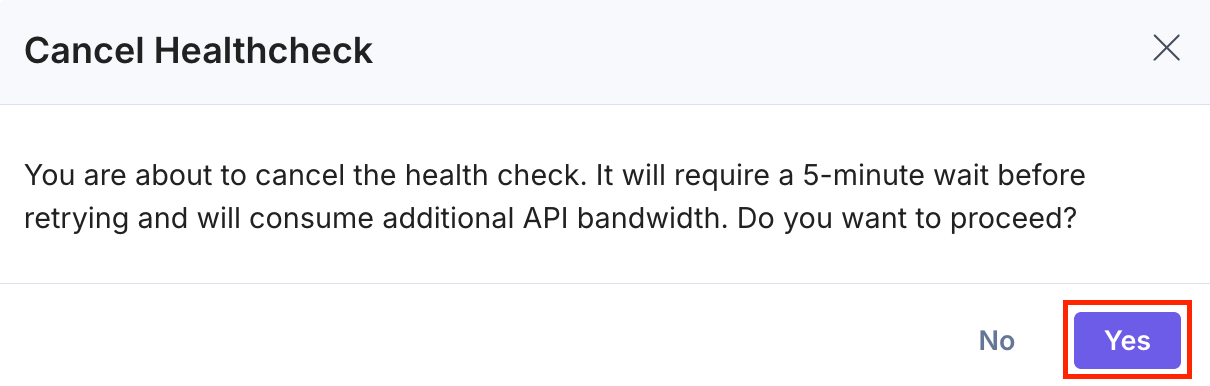
If cancelled, the status updates to Terminated, and the app redirects you to the welcome screen.
- After the app finishes examining your stack, on the selected entities, it displays a comprehensive dashboard of its overall health.
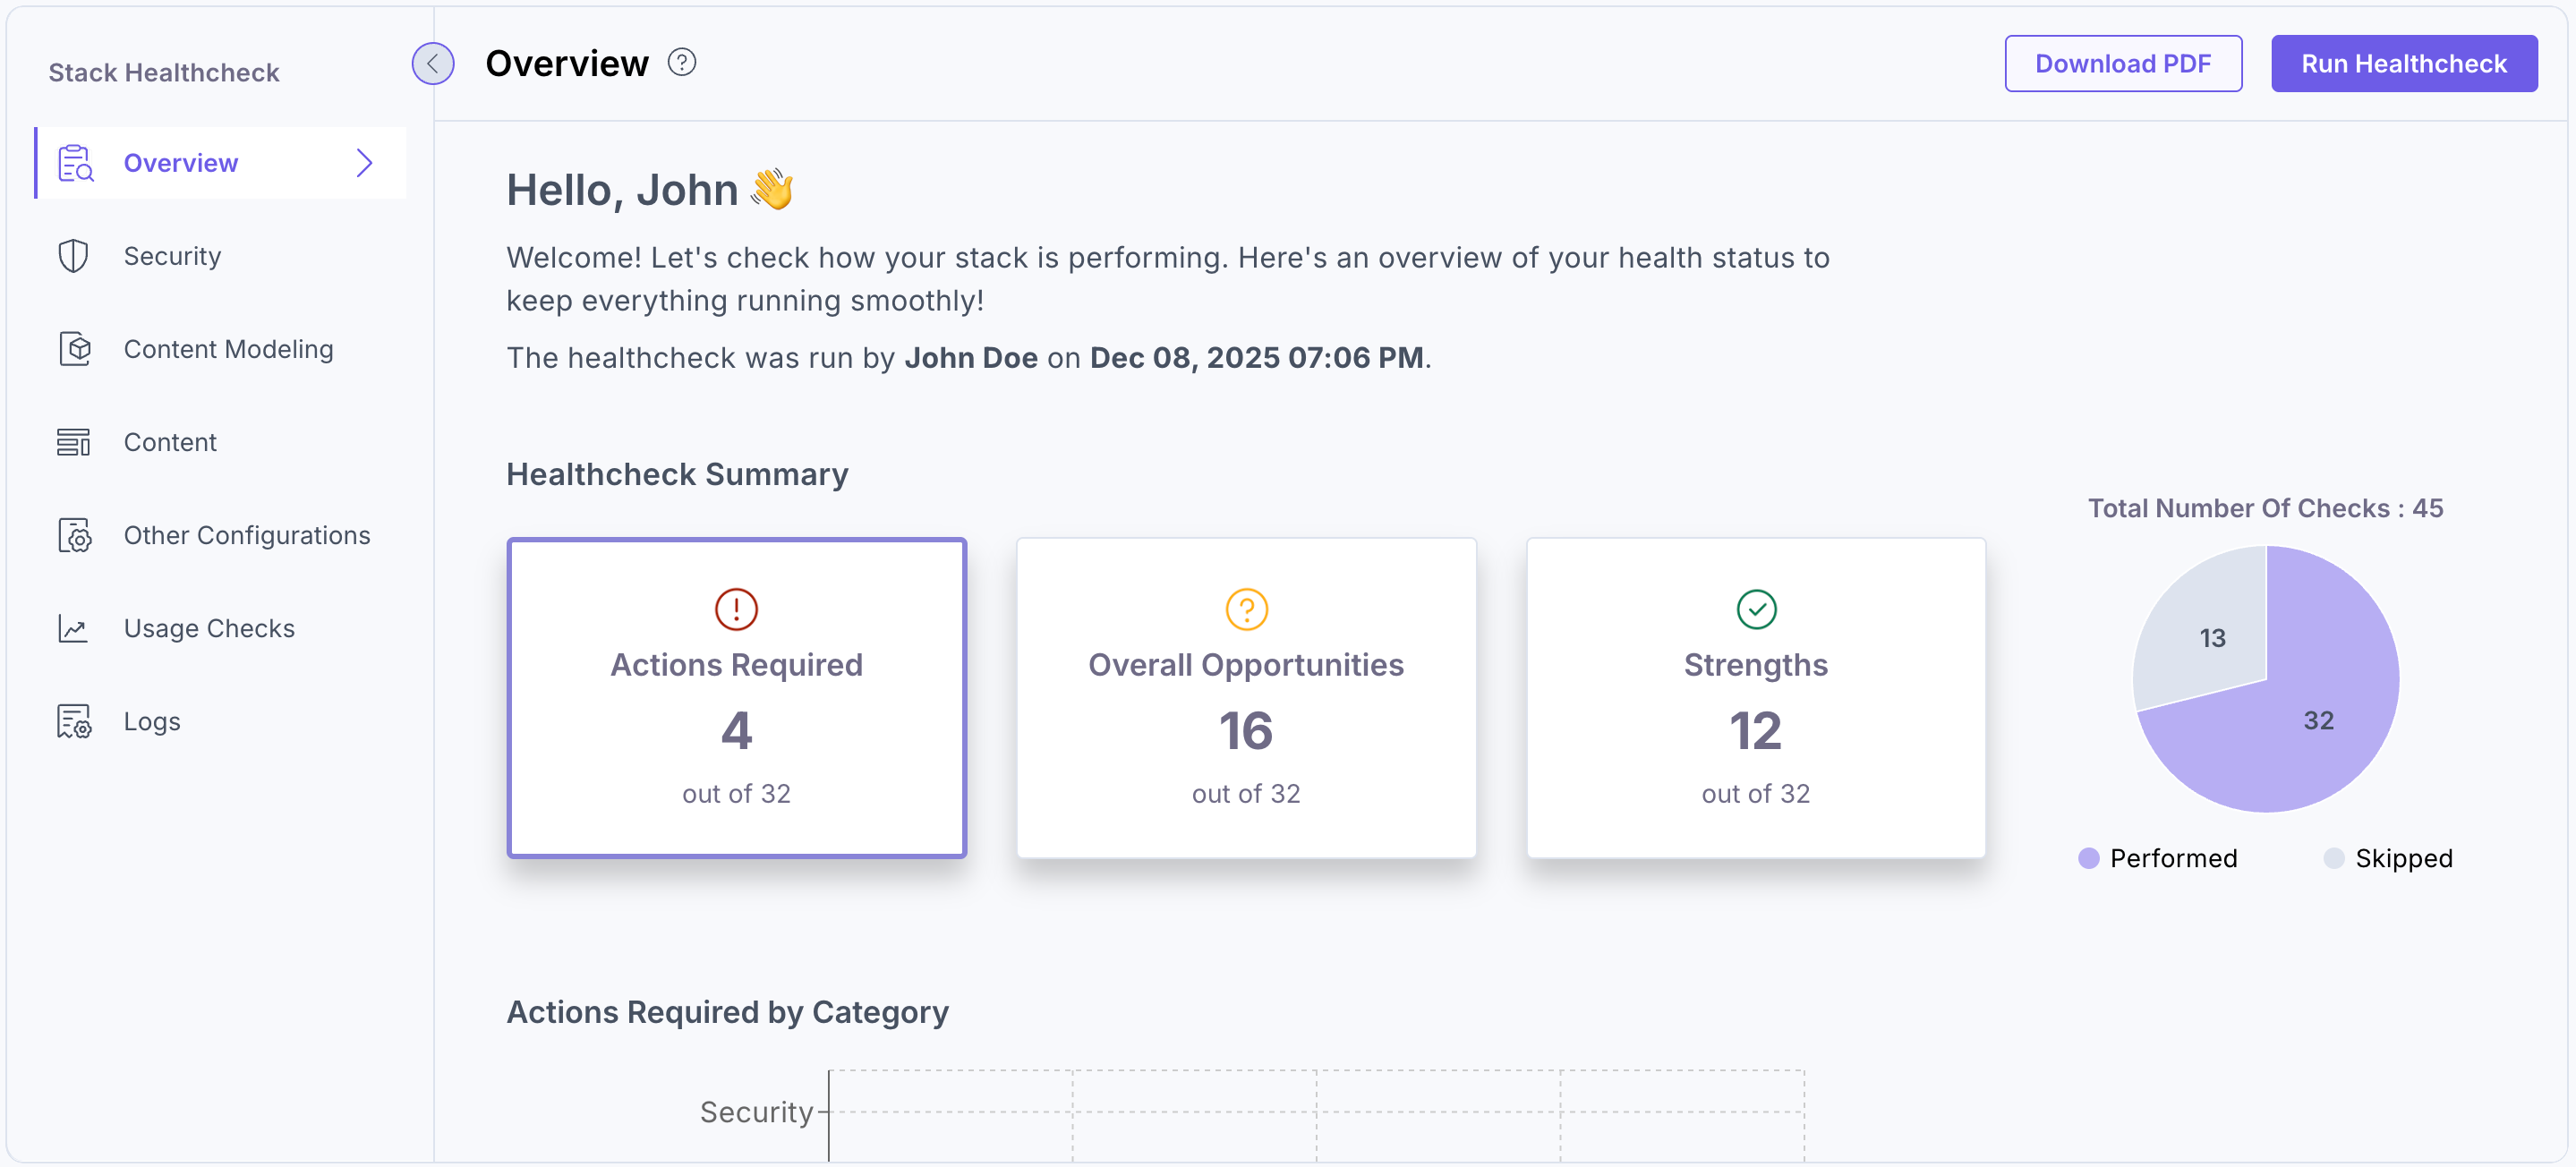
The dashboard displays a summary of your stack’s health, including the number of actions required, opportunities, and strengths, along with a bar graph. It also shows the total number of checks performed and skipped, represented in a pie chart.
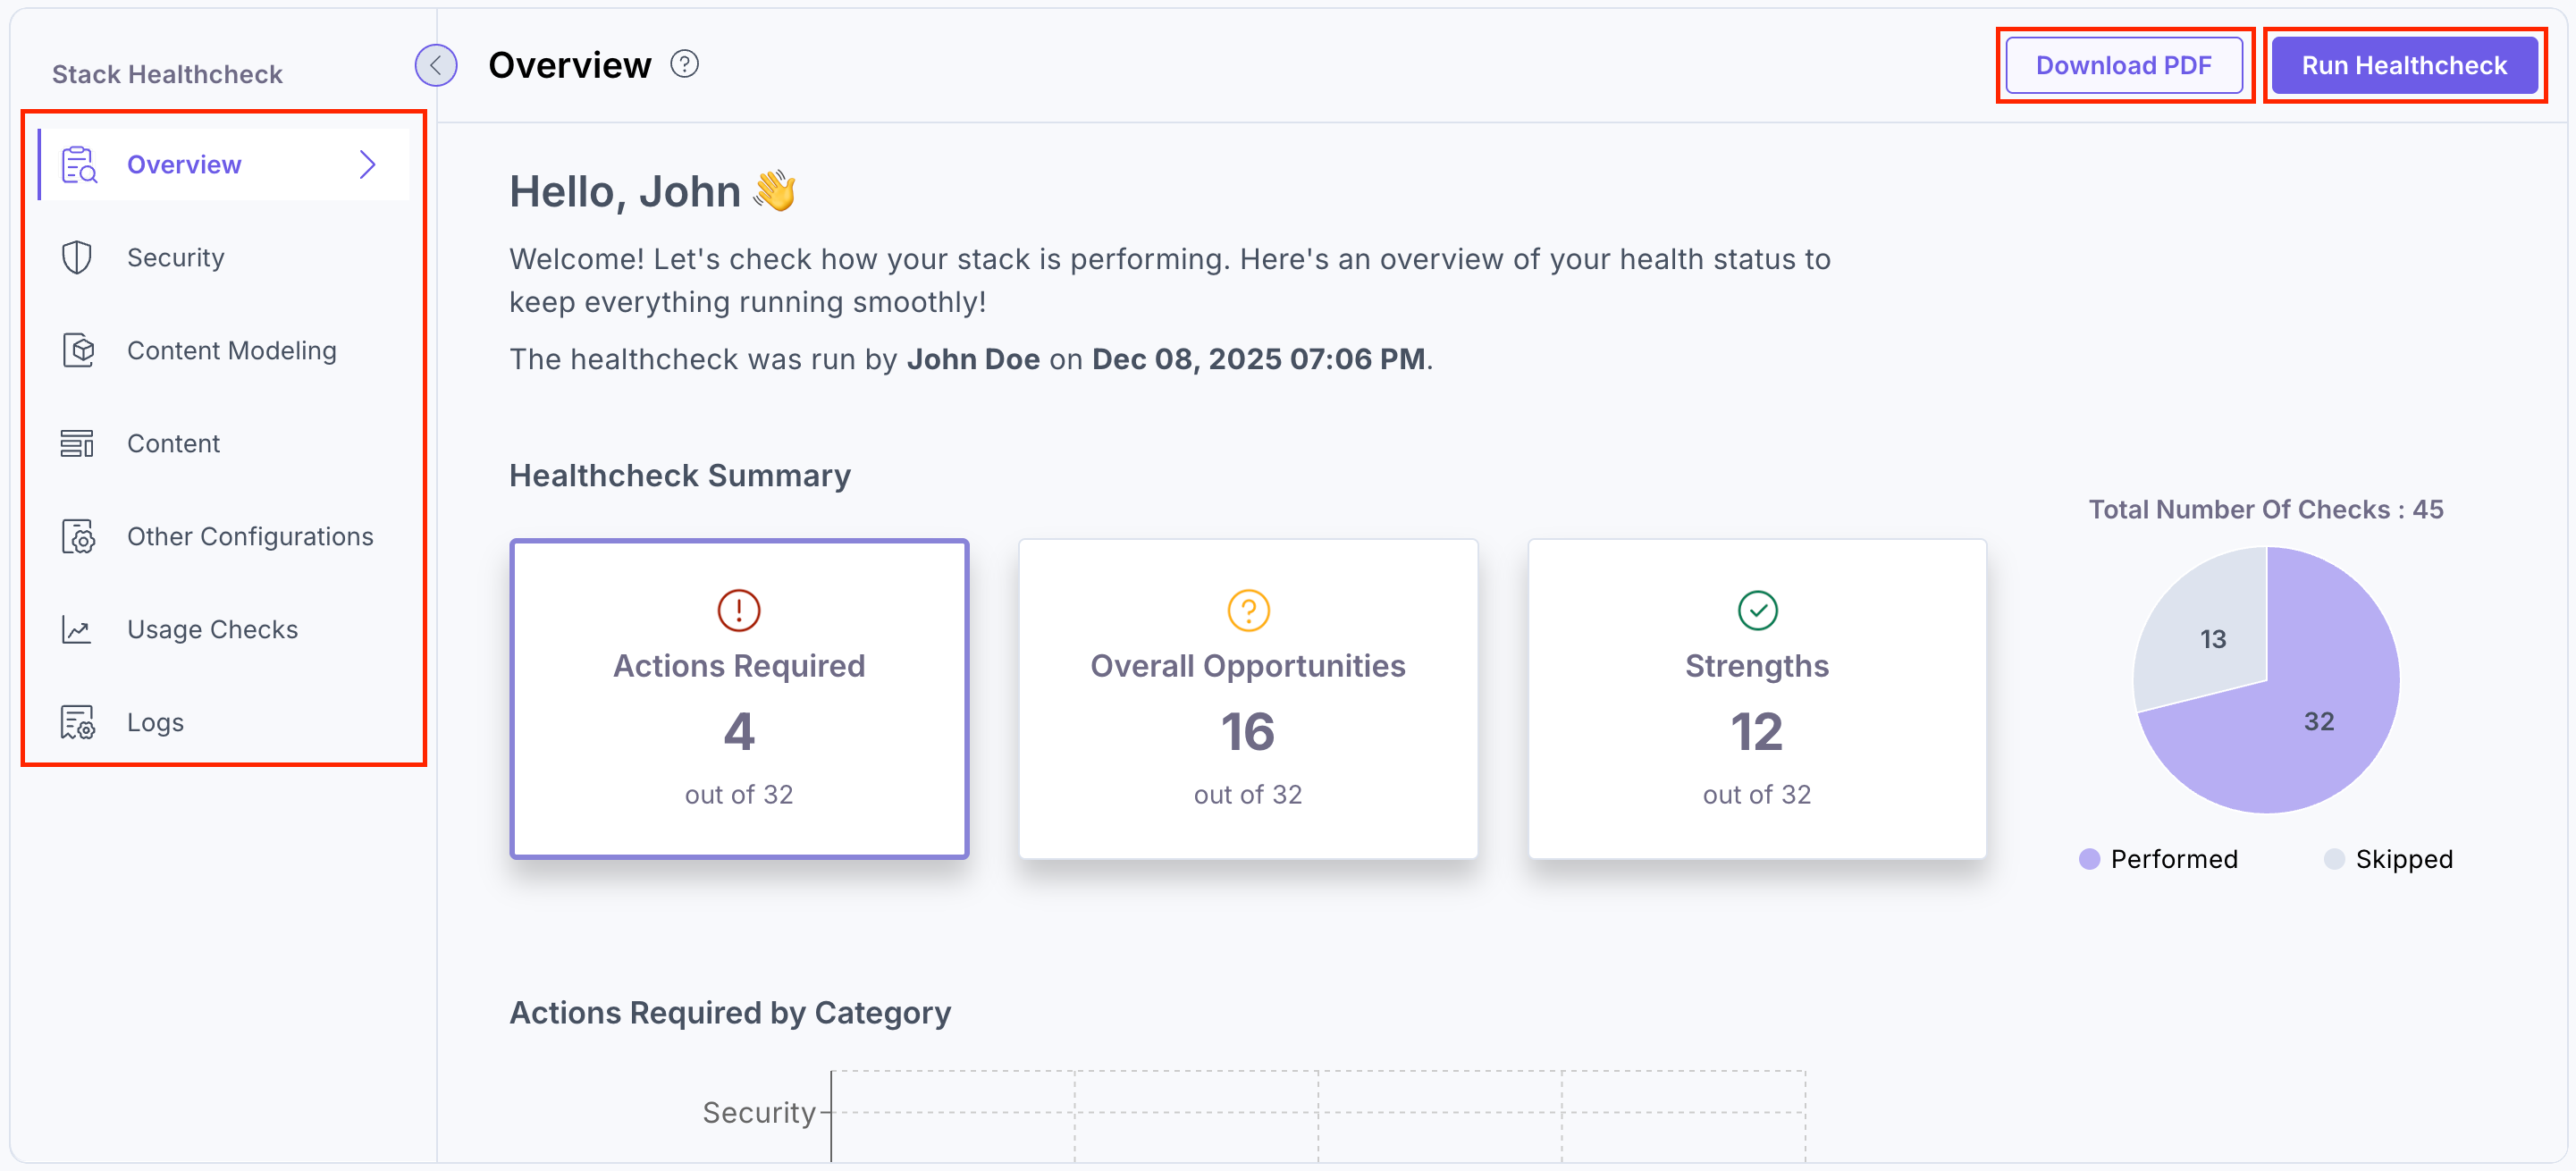
The top right corner contains two buttons:
- Download PDF: You can download the summary of the Healthcheck report by clicking this button.
Note: Ensure to enable the Healthcheck Report Download toggle during app configuration in step 1.
- Run Healthcheck: Click the Run Healthcheck button to customize selections and run the health check again.
Note: When the run on healthcheck is cancelled, the status updates to Terminated, and the app redirects to the previous report.
The left navigation panel displays the Overview, Security, Content Modeling, Content, Other Configurations, Usage Checks, and Logs sections.
- Download PDF: You can download the summary of the Healthcheck report by clicking this button.
Let's discuss the left-navigation options in detail.
Overview
Overview is the default view that appears after a Healthcheck is completed. It provides a clear summary of your stack’s overall health, including high-level insights, check results, and visual indicators to help you quickly assess areas that require attention.
Healthcheck Summary
At the top of the dashboard, the Healthcheck Summary displays three key result categories:
Actions Required: This Indicates issues in your stack that need immediate attention. These may include missing descriptions, unused content types or global fields, token or configuration concerns, security risks, outdated content, or other factors that may impact stability or performance.
Overall Opportunities: This highlights potential improvements or refinements that can help optimize content modeling, security, governance, asset usage, and editorial workflows. These items are not critical, but addressing them contributes to a better-structured and more efficient stack.
Strengths: This represents the areas where your stack meets best practices. This may include strong content modeling, clean configurations, effective asset organization, appropriate field usage, and well-maintained content structures.
Each category card shows the number of checks that fall under that result type.
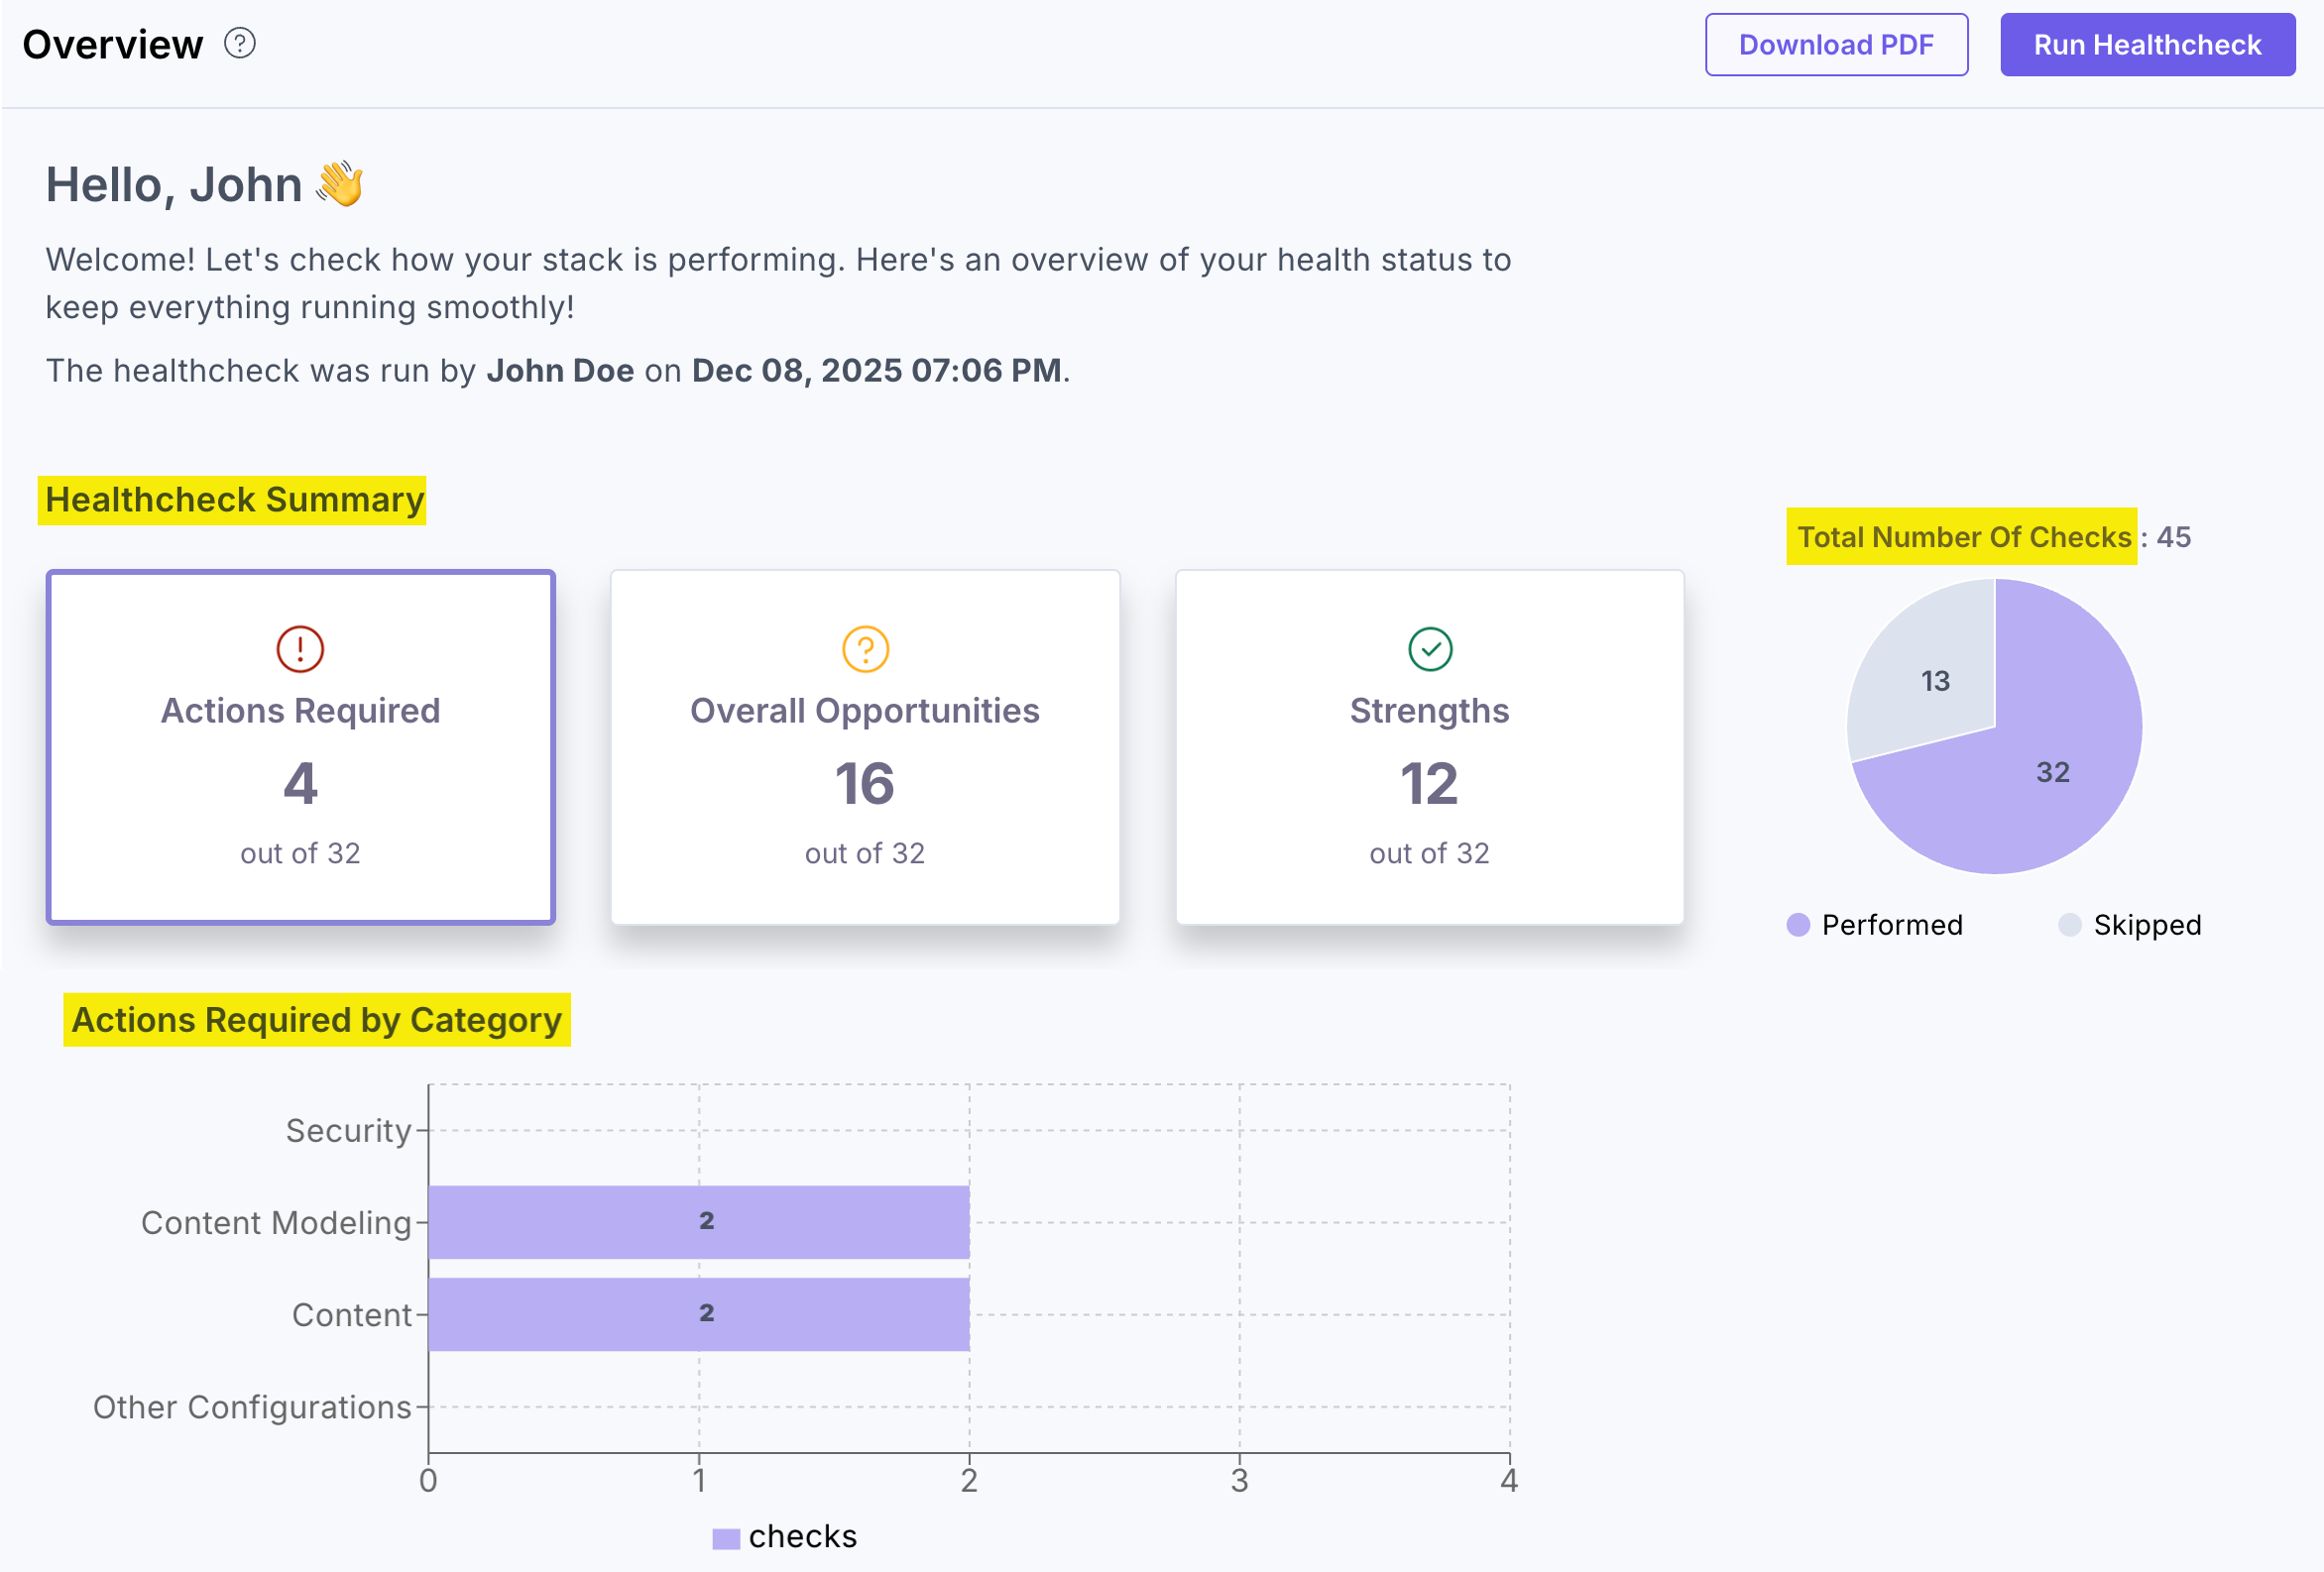
Total Number of Checks
To the right of the summary cards, a pie chart displays the total number of checks executed during the Healthcheck. The results are grouped into two segments:
- Performed: Total checks that were run based on your configuration.
- Skipped: Checks not applicable or intentionally excluded before running the Healthcheck.
This visualization provides a quick breakdown of execution coverage across your selected categories.
Category-Level Breakdown
Below the summary, the dashboard displays bar graphs for Actions Required, Overall Opportunities, and Strengths. Each graph shows how the checks in that result type are distributed across categories such as Security, Content Modeling, Content, and Other Configurations.
These visual breakdowns make it easier to identify which areas need attention, where improvements can be made, and where your stack already aligns with best practices.
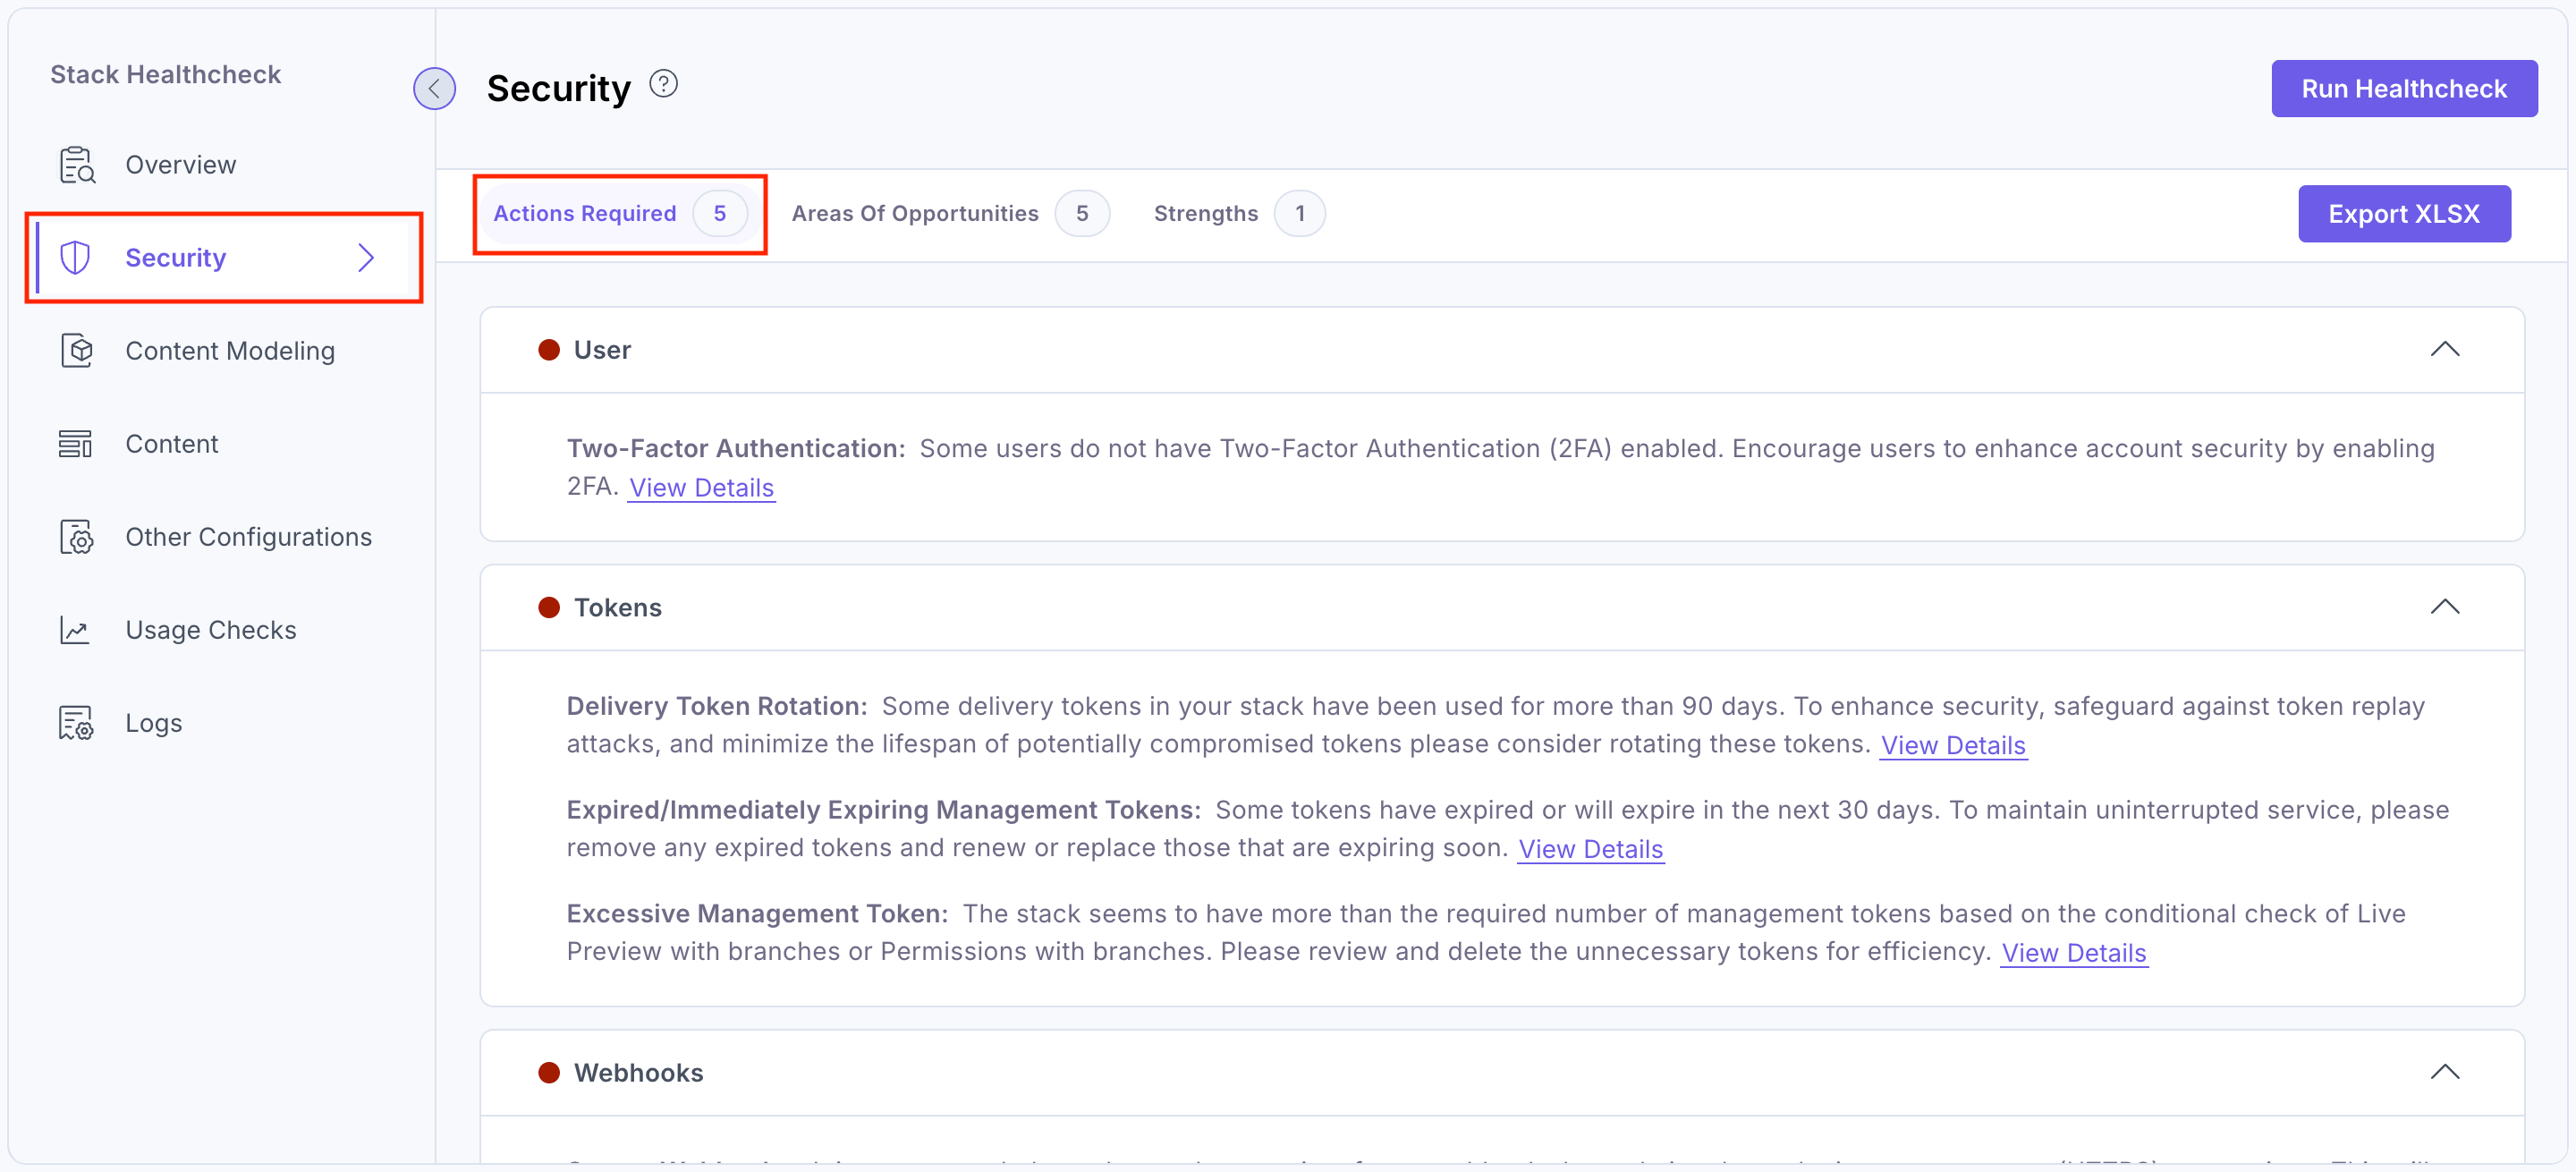
Security
Under the Security tab, the Contentstack Healthcheck app examines potential security vulnerabilities or issues that could affect the stack's integrity and safety.
For example, expiring or excessive unwanted tokens, delivery token and management token usage, access controls (single sign-on authentication and two-factor authentication), or insecure webhooks.
The Healthcheck app can analyze security-related metrics to help identify and address security concerns and keep the Contentstack platform secure and protected.
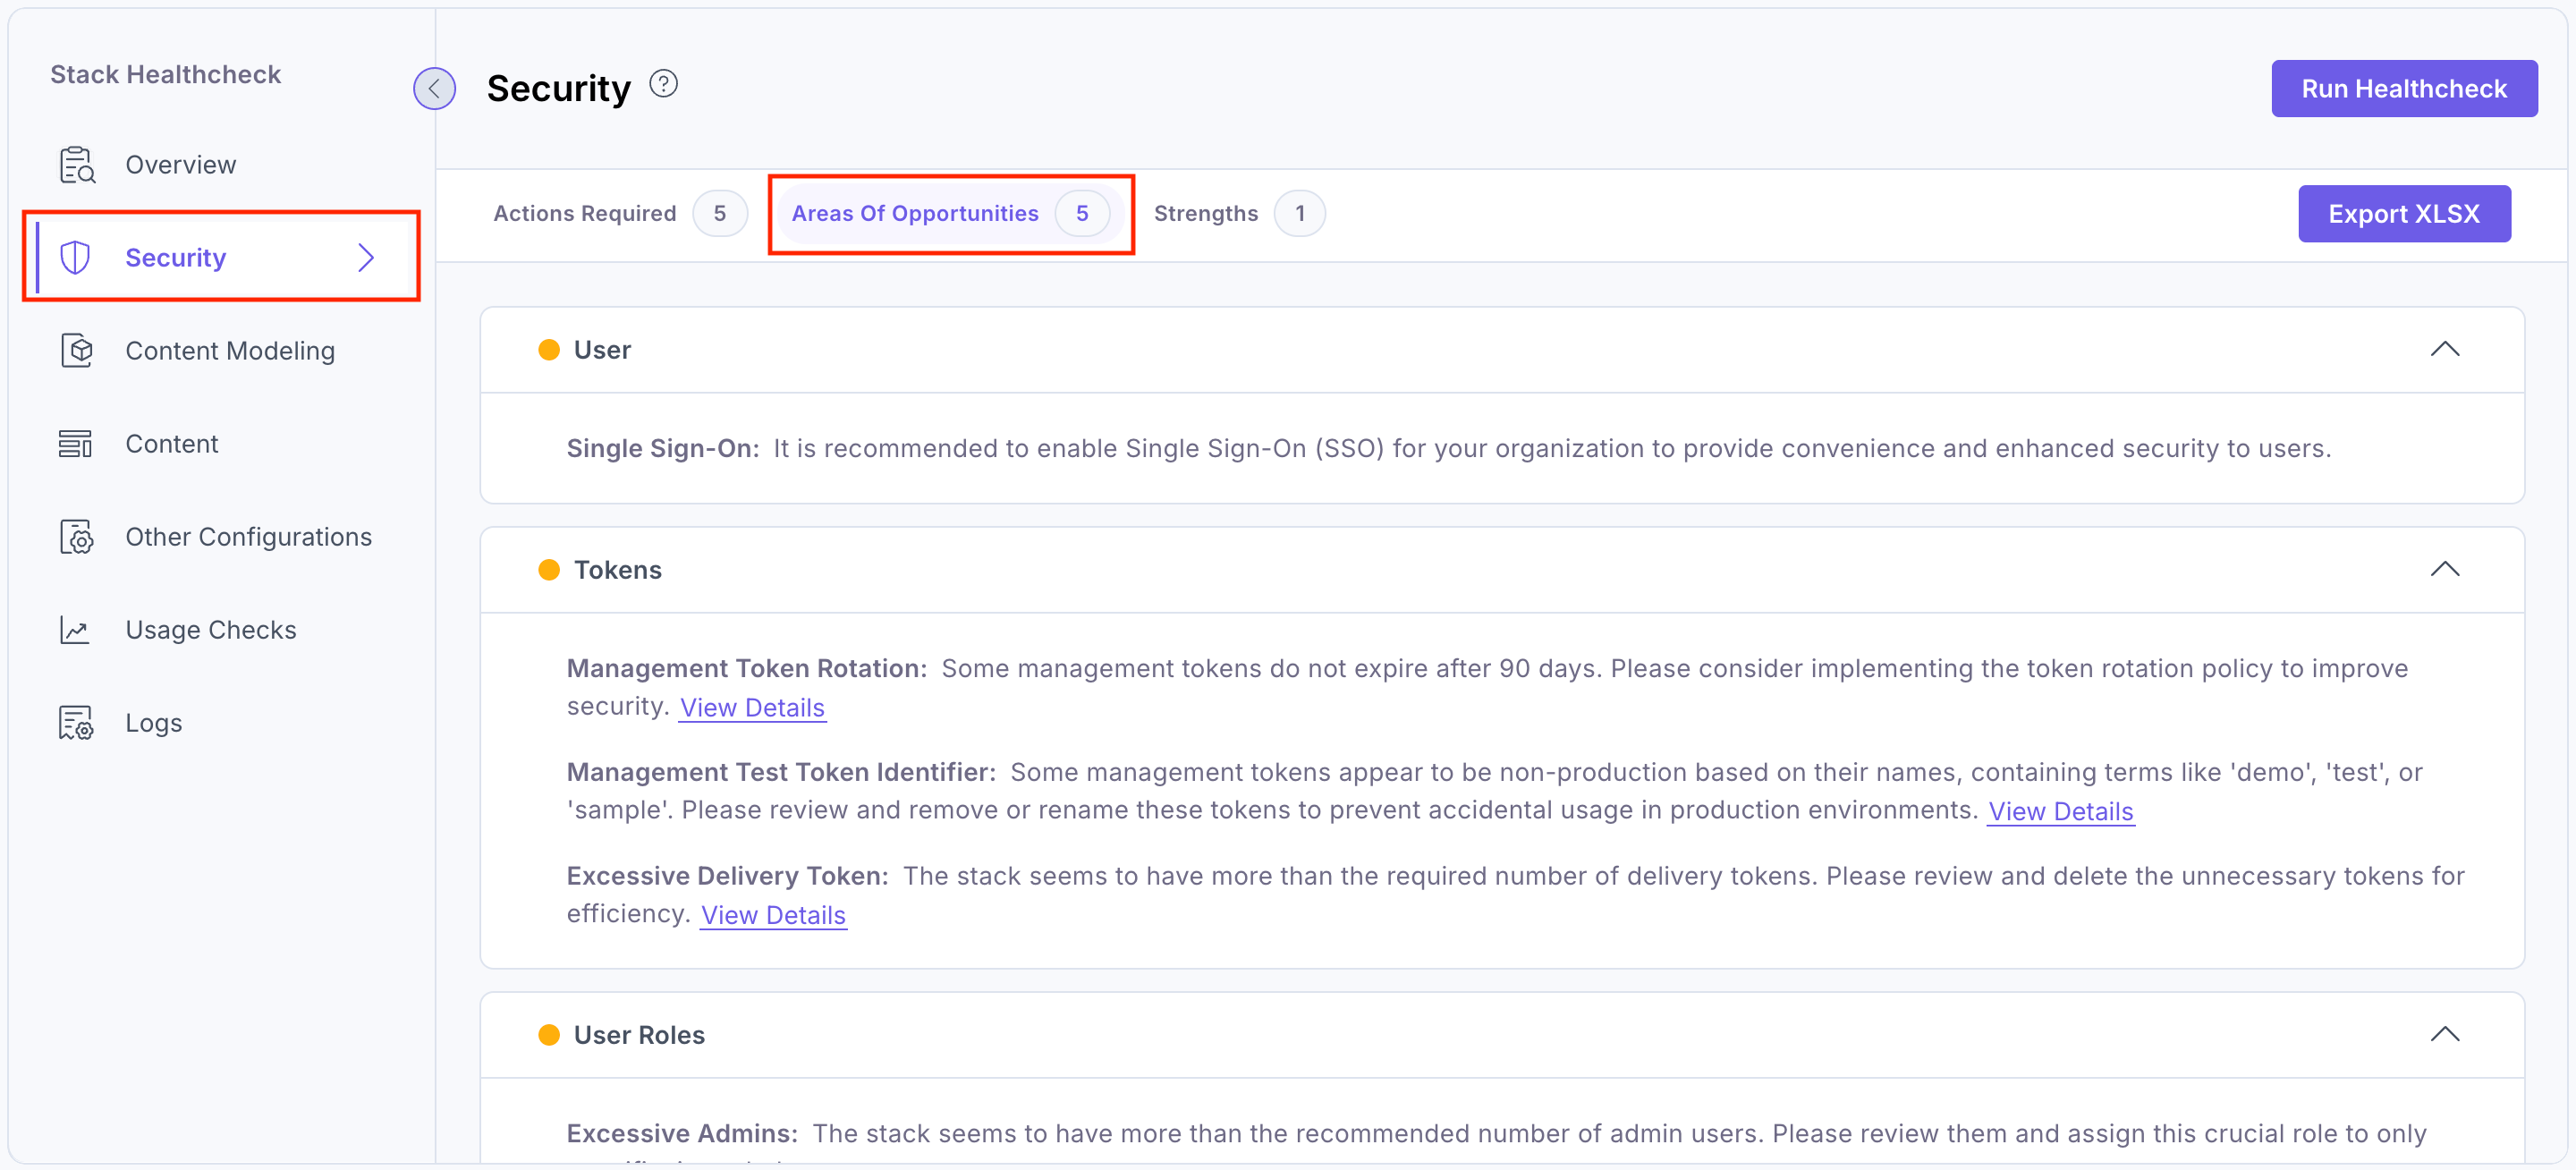
The Security section shows three categories:
Actions Required:
Areas of Opportunities:
Strengths:
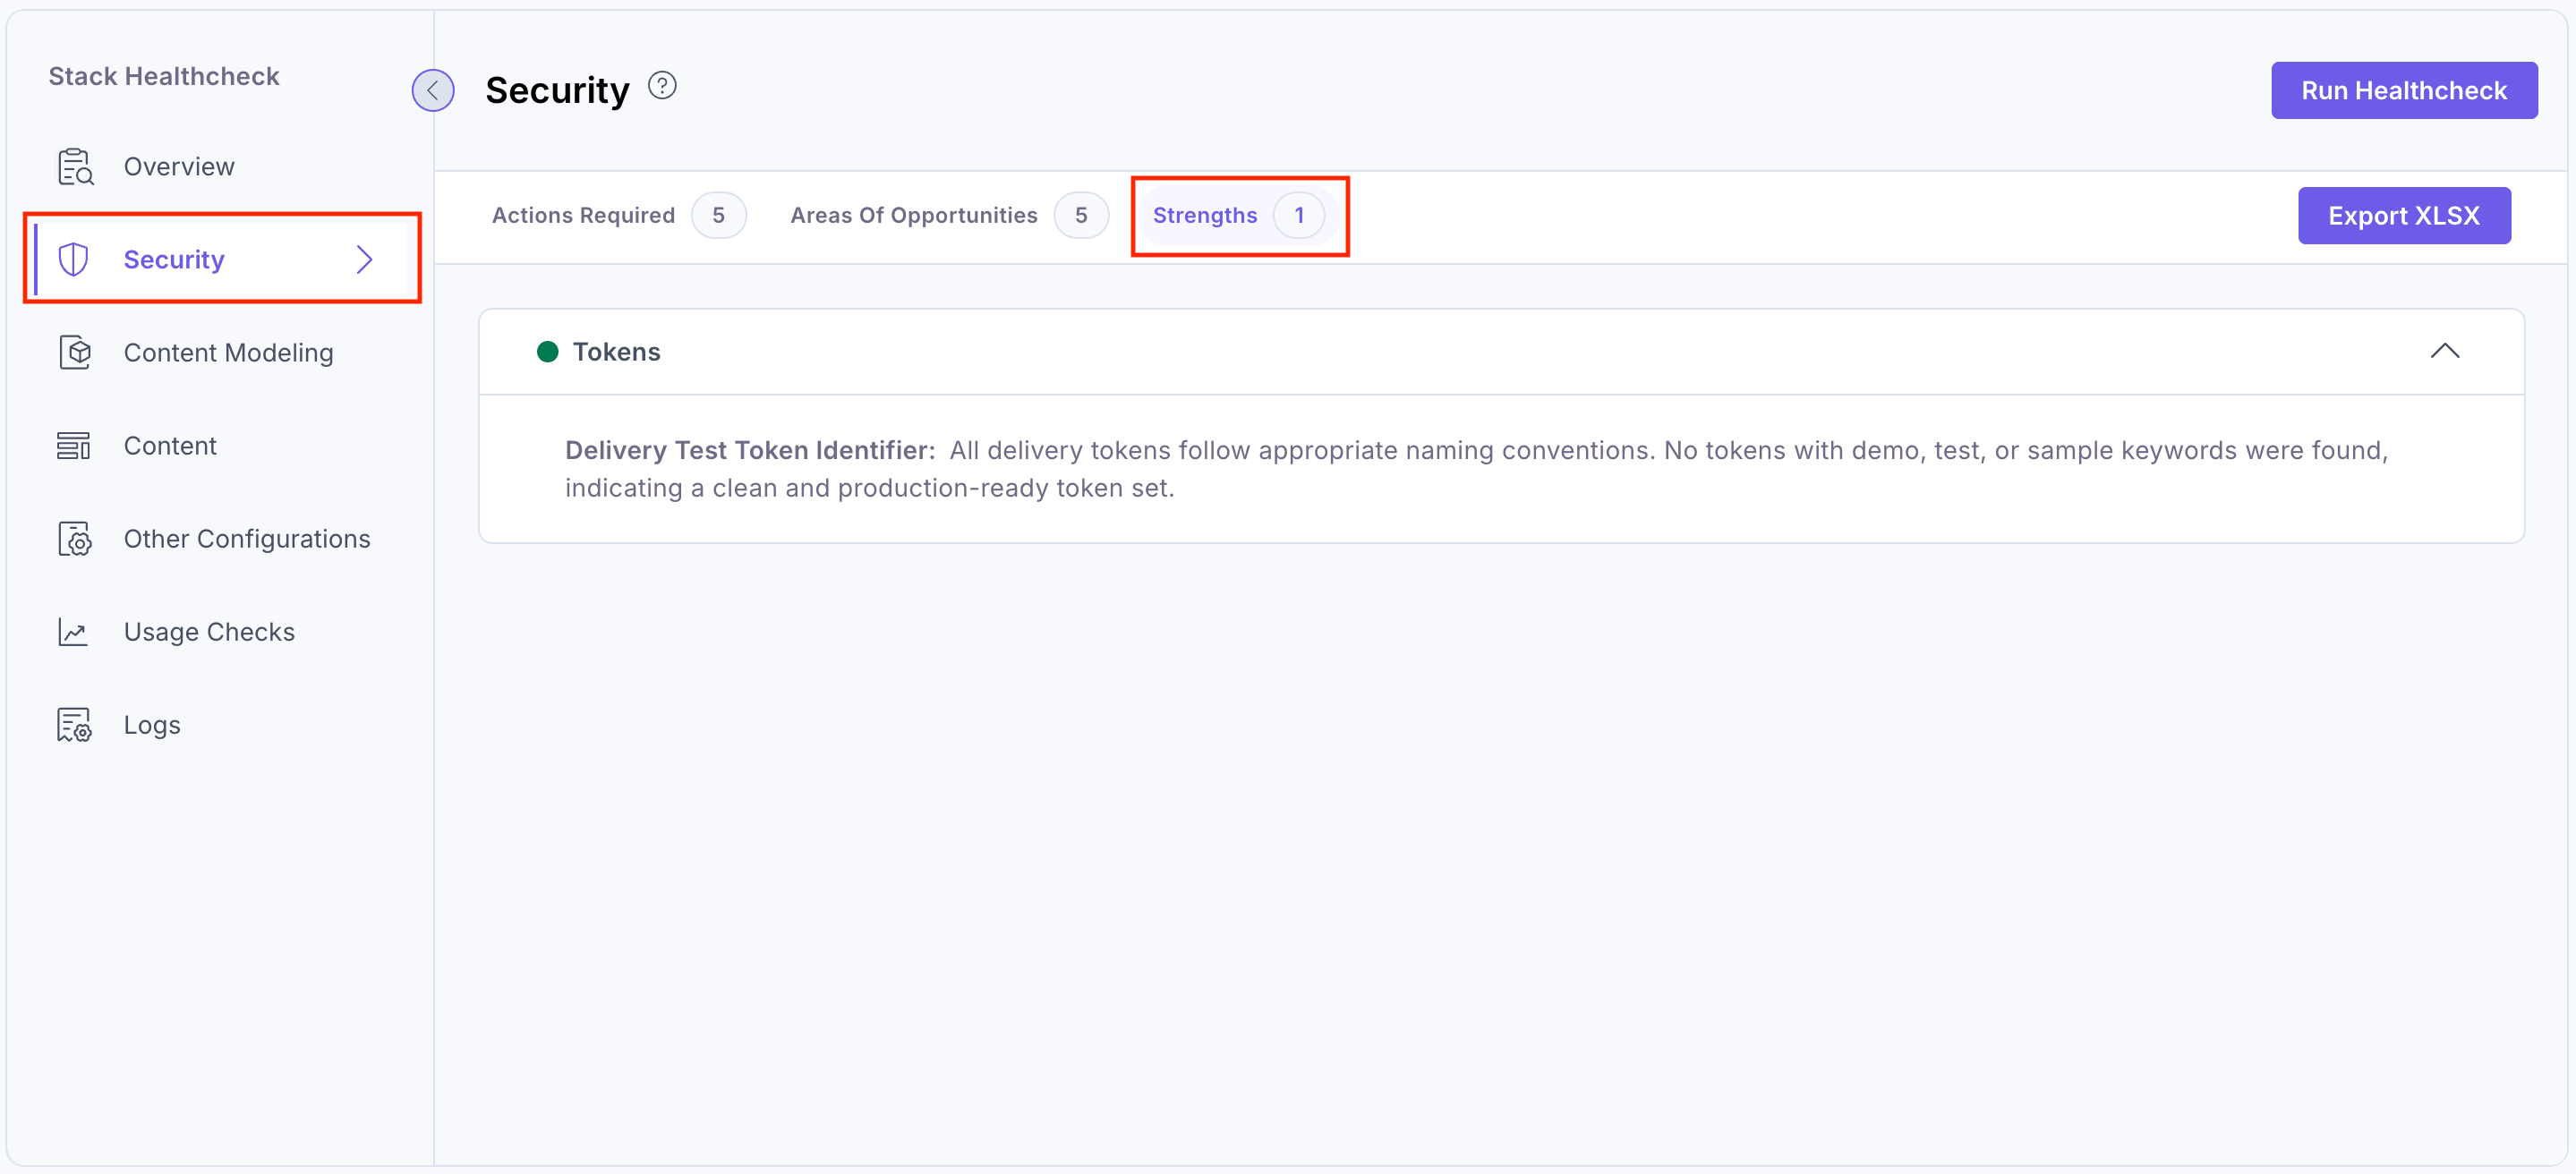
You can click View Details to view the security issue in detail. Then, you can edit and resolve the issue by clicking the respective row or using the edit icon, which will take you to the respective settings section.
You can download a detailed .xlsx report for the Security category by clicking the Export XLSX button.
Additional Resource: For more information, refer to the Invite Users and Assign Roles documentation.
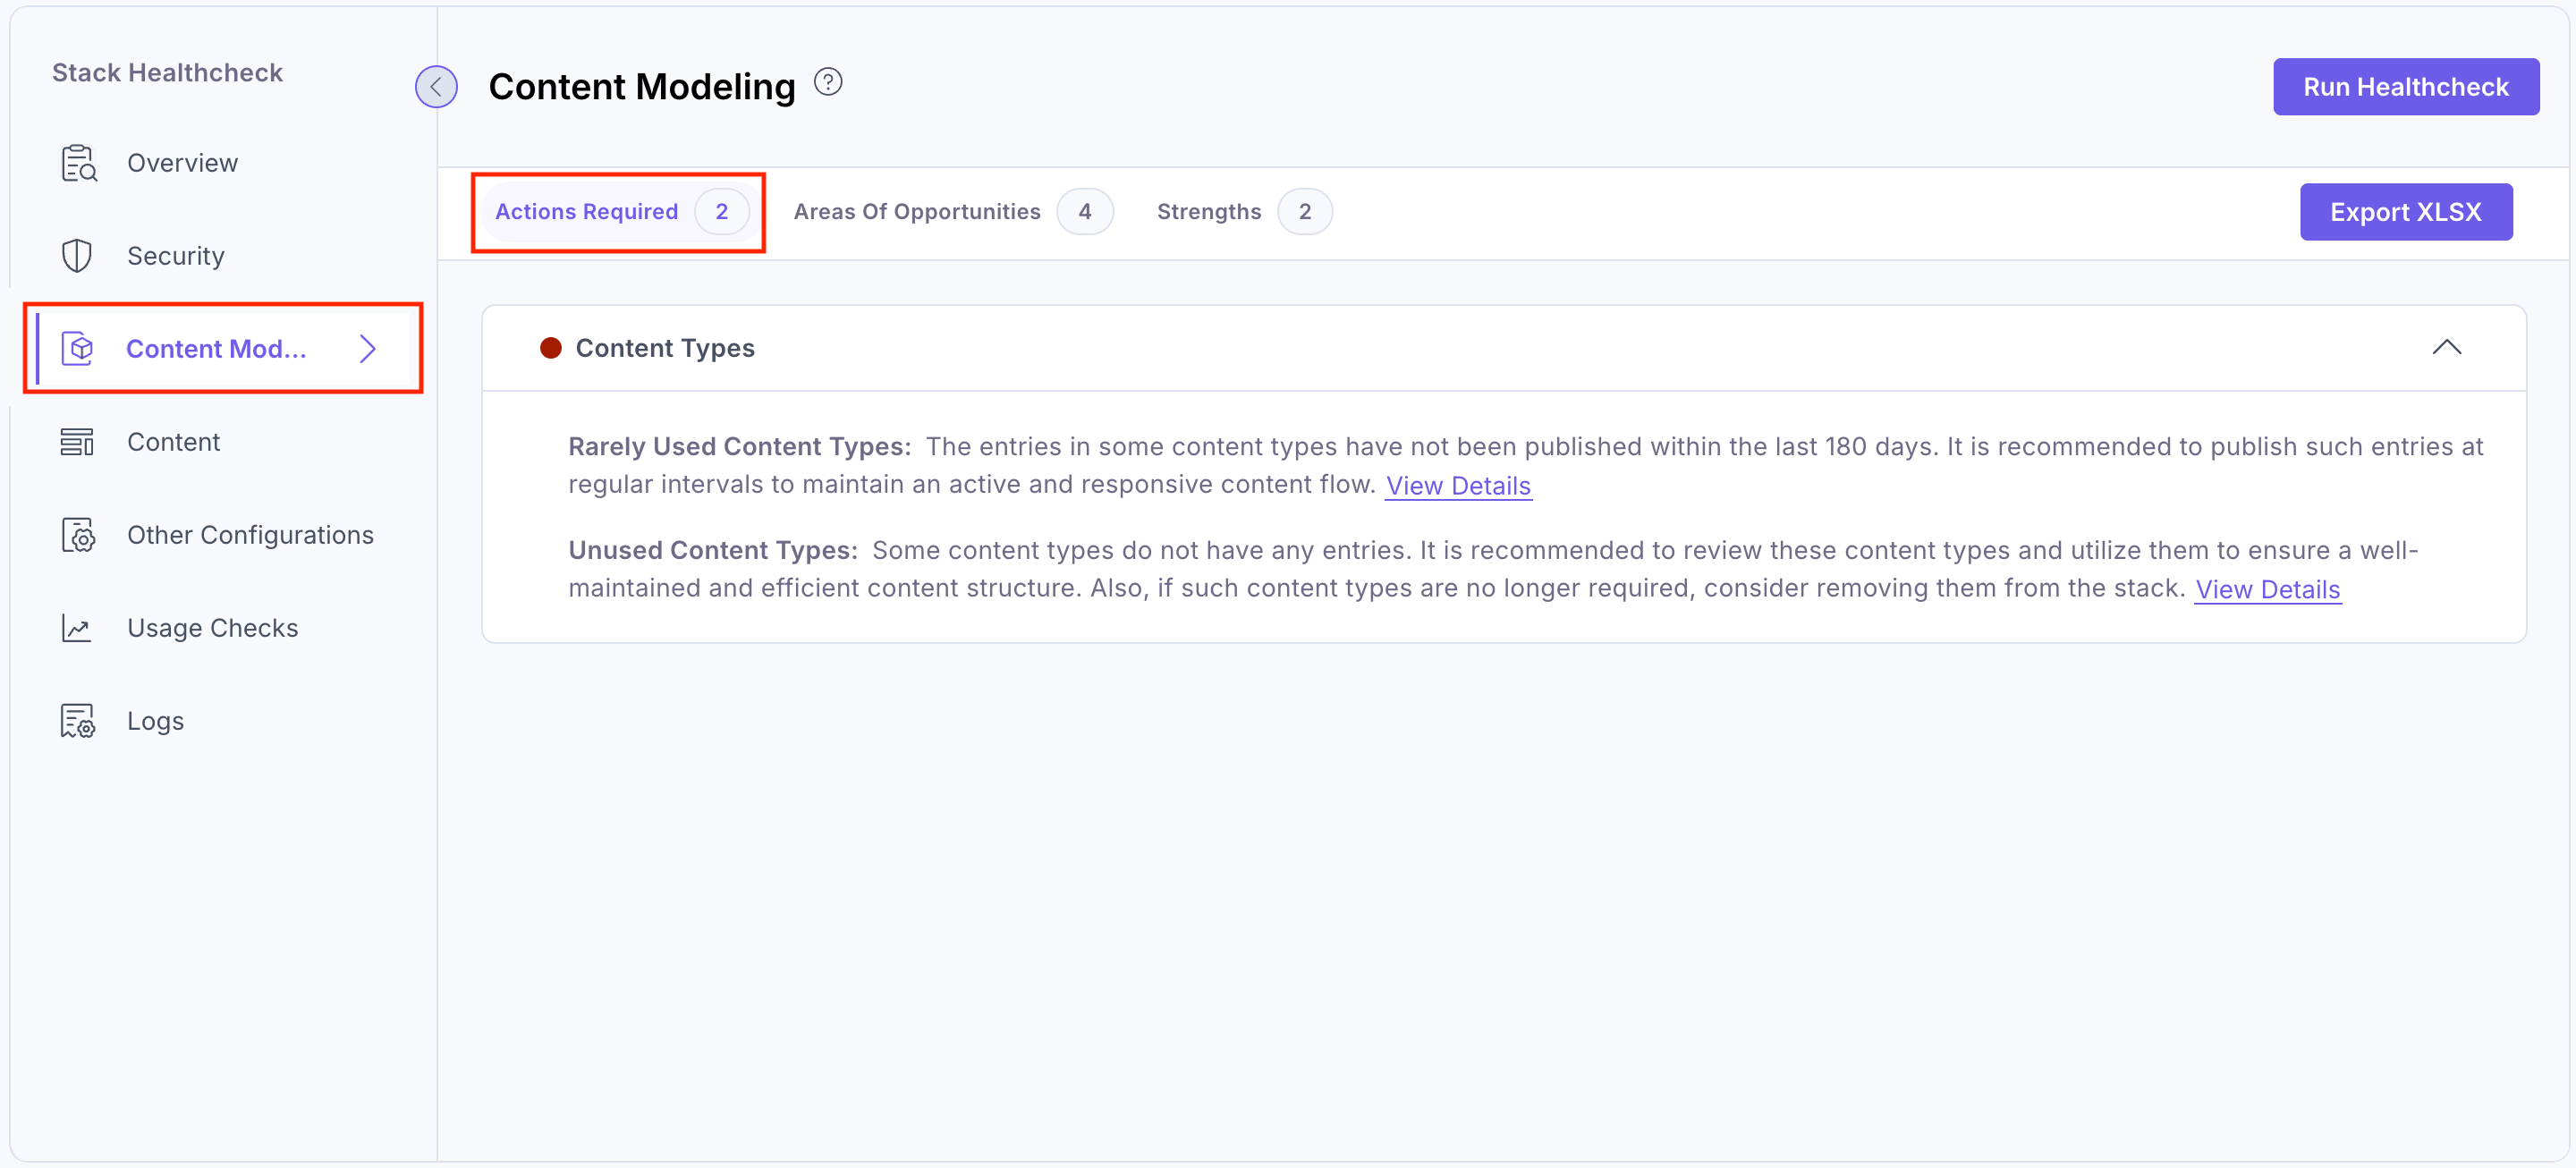
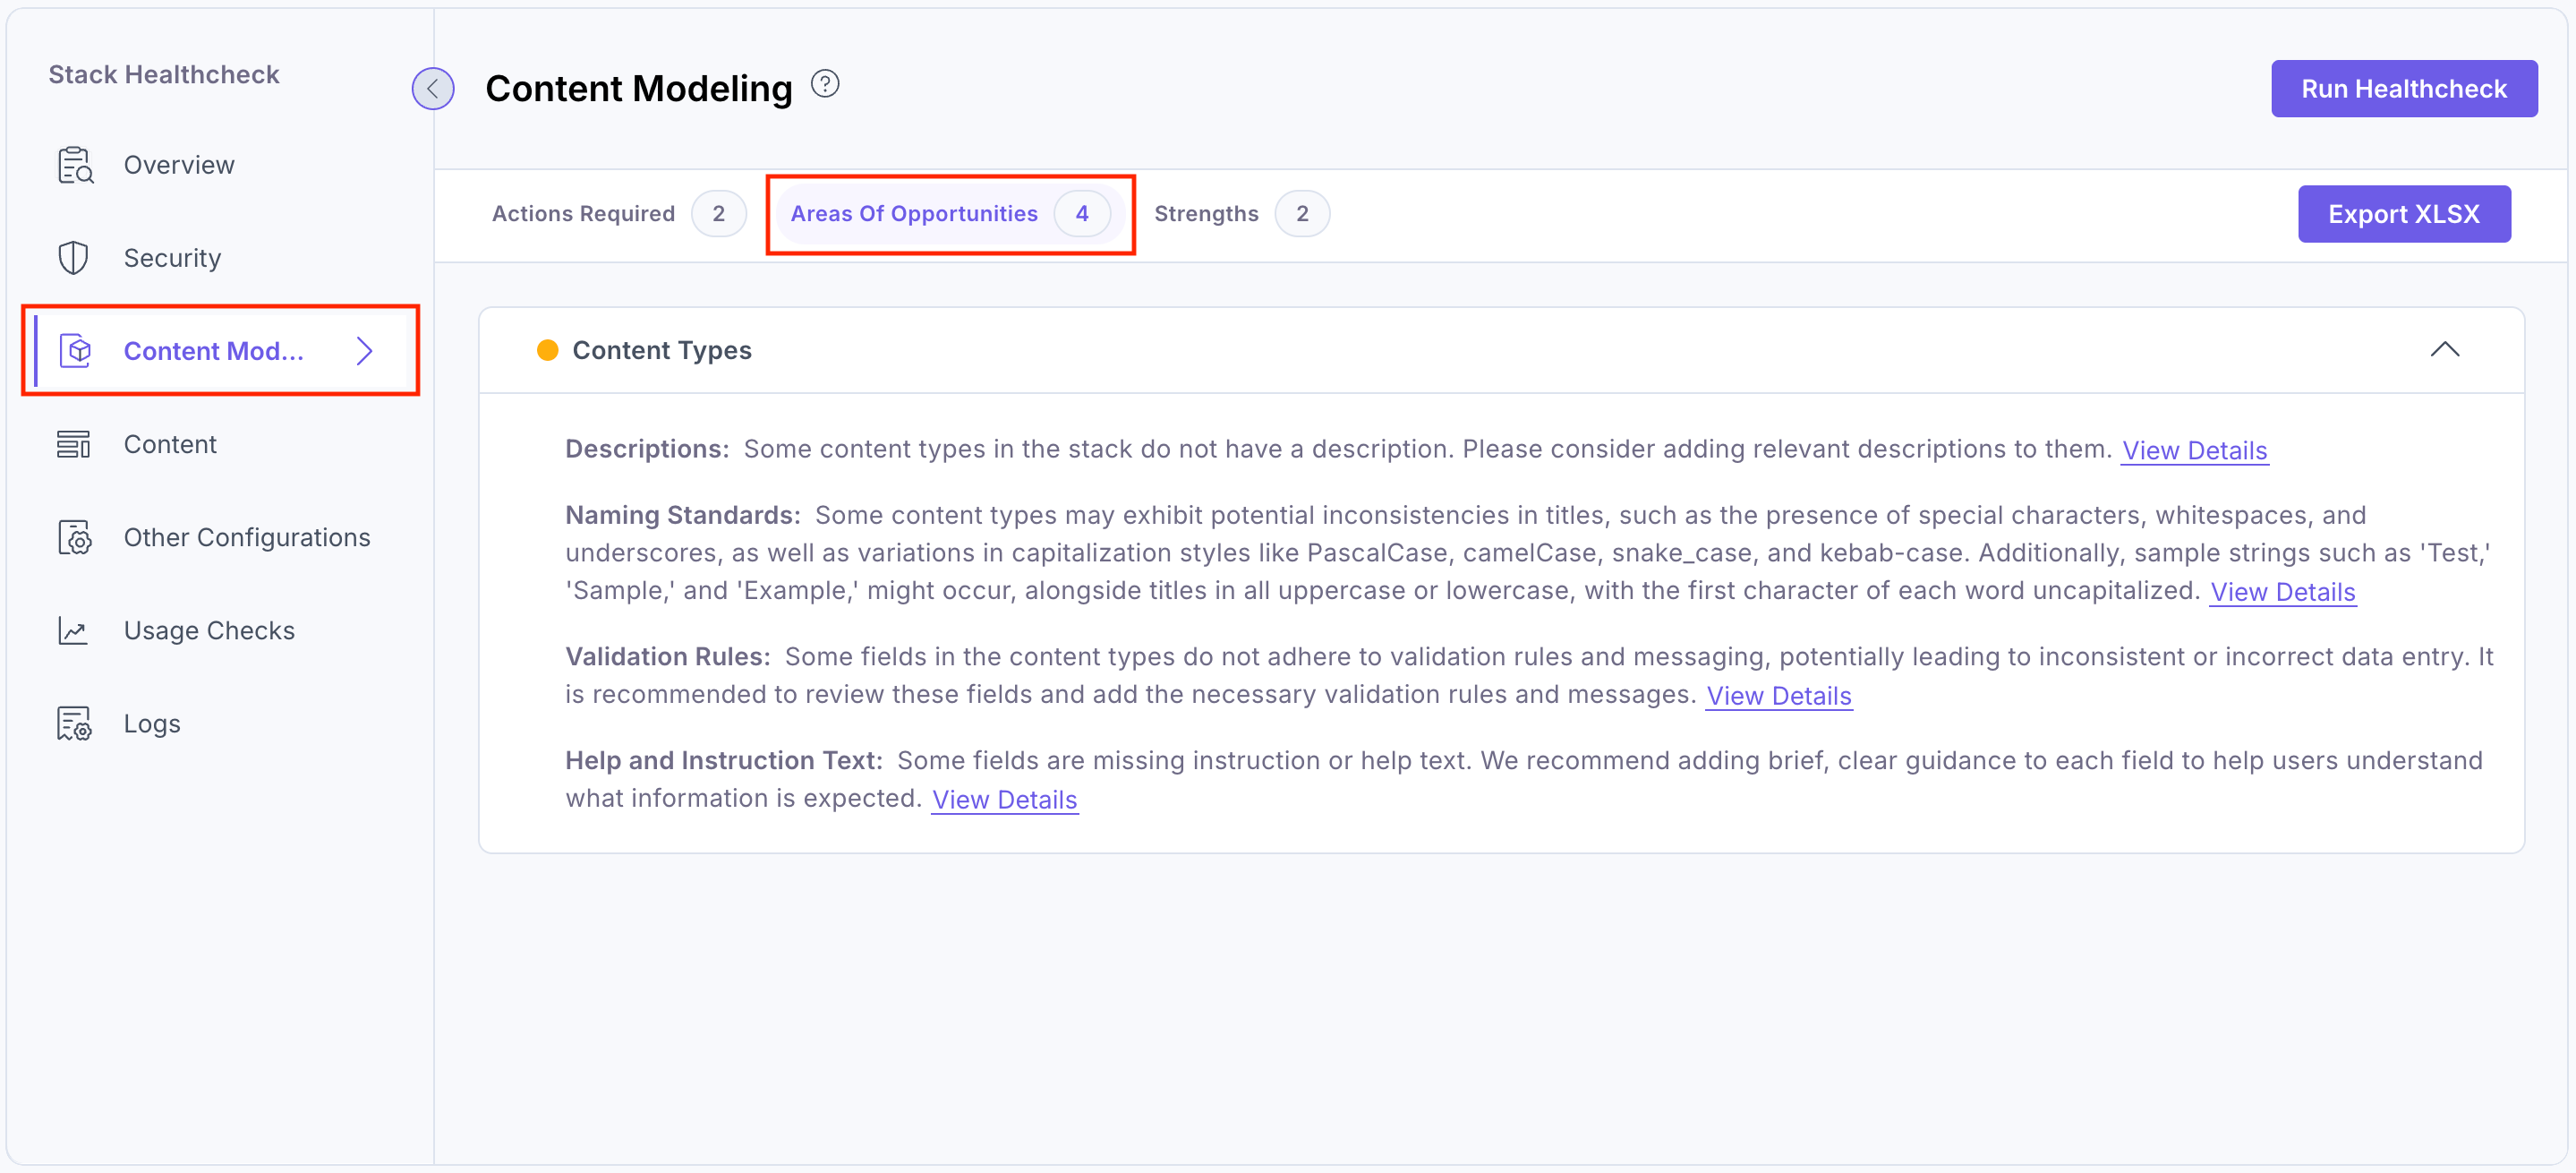
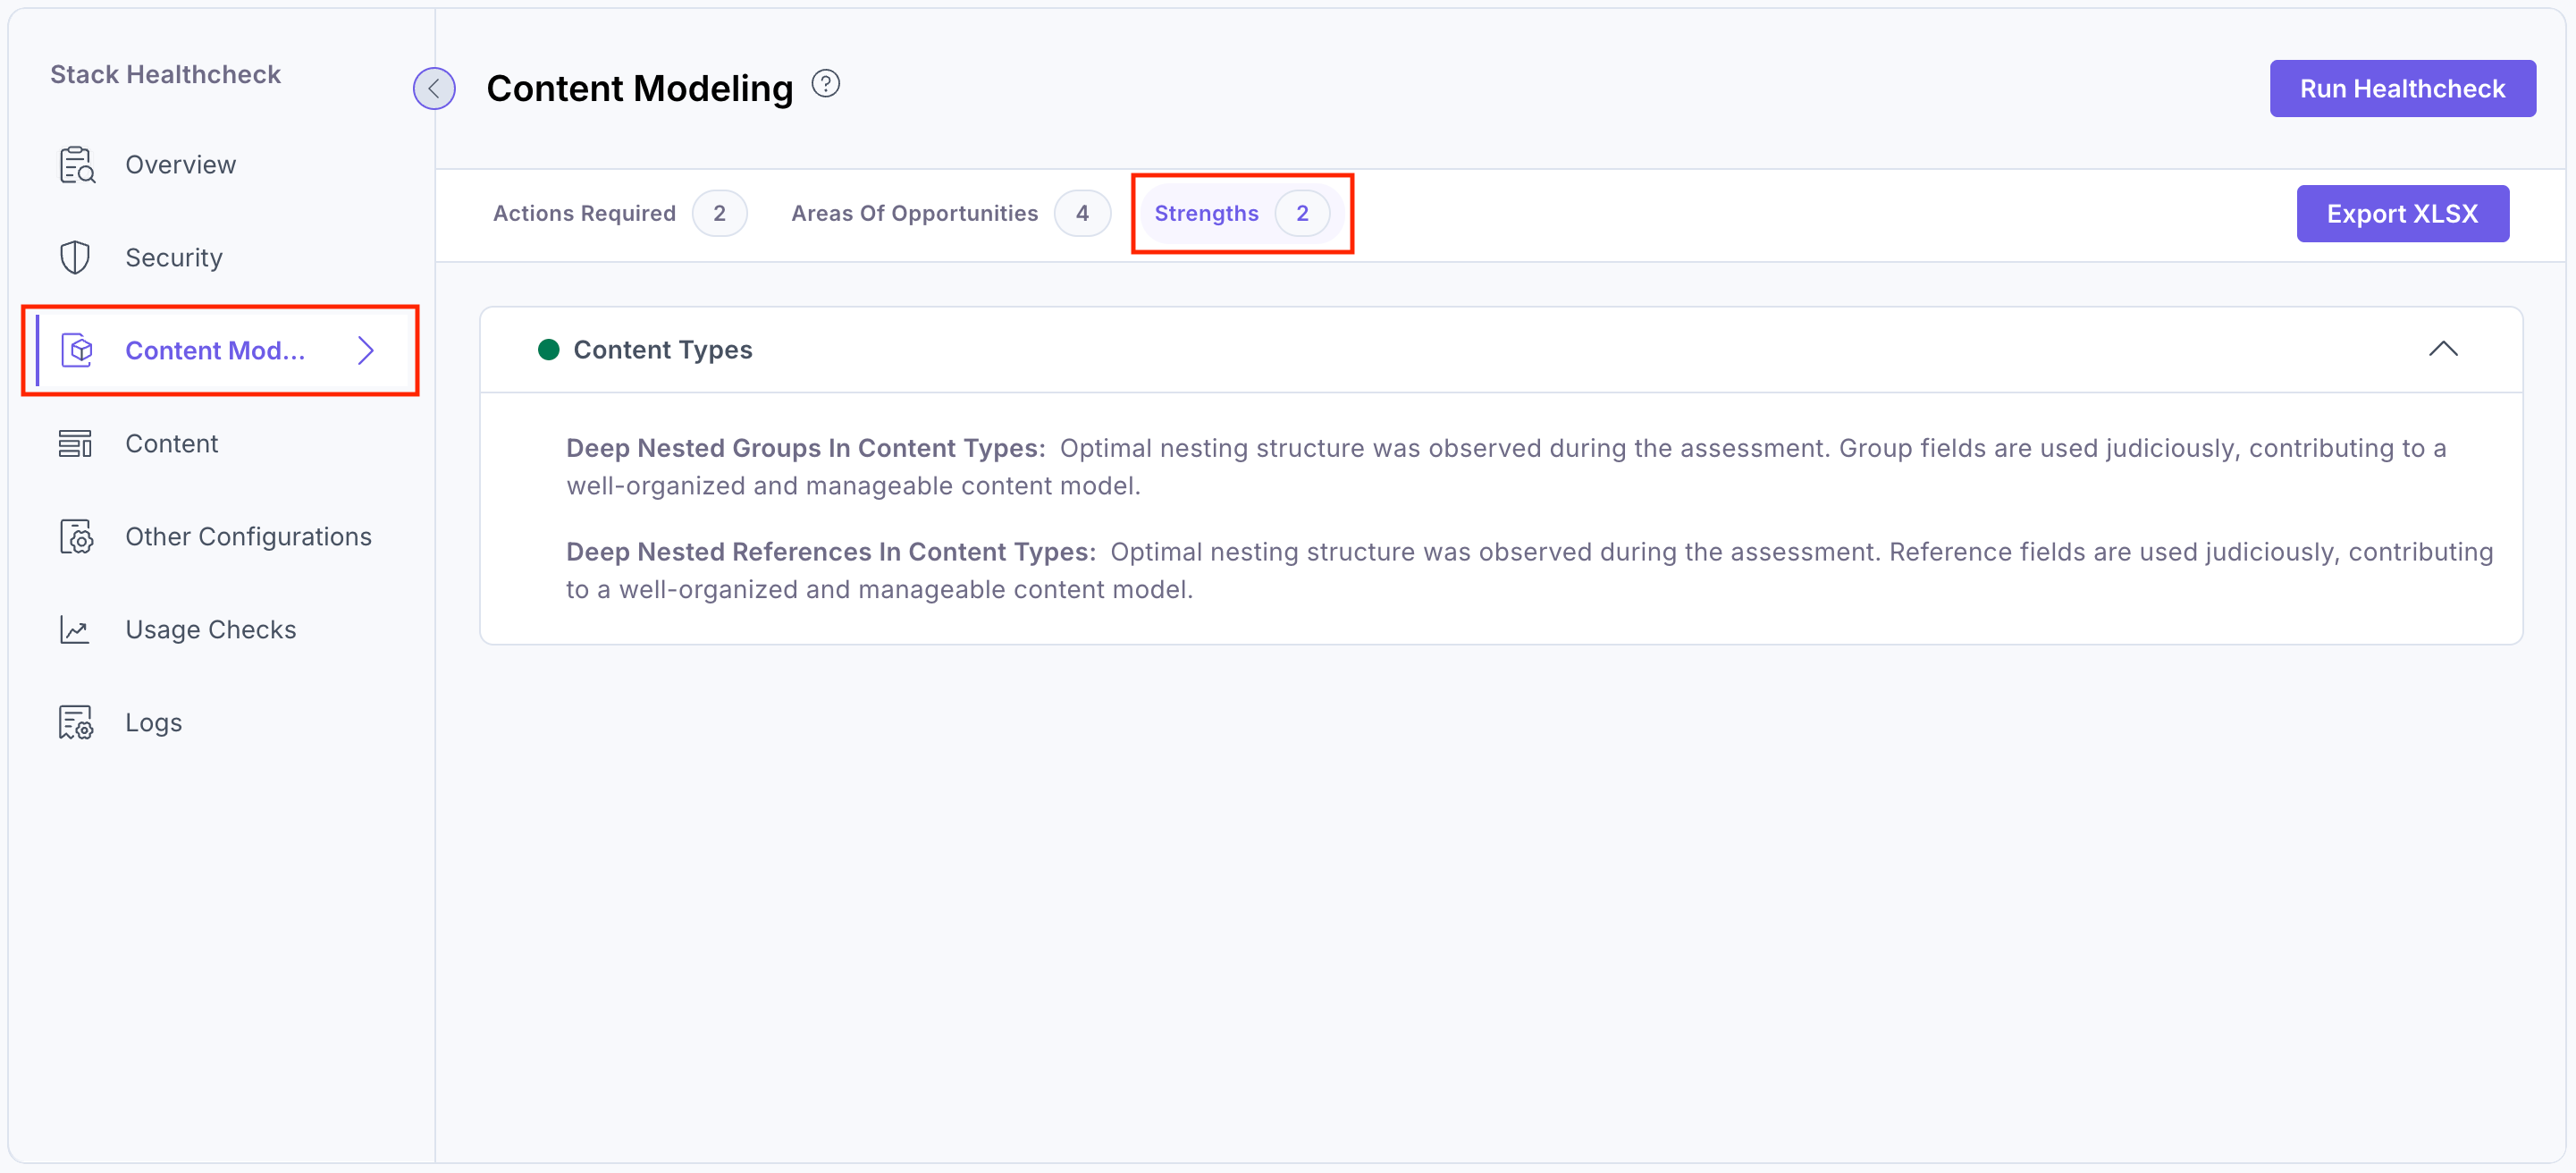
Content Modeling
Under the Content Modeling tab, the Healthcheck app displays the assessment results related to the integrity and structure of your content model.
This includes checking for naming standards, unused or rarely used content types and global fields, global field redundancy, missing descriptions, help and instruction texts, exceeding nesting levels in groups and reference fields, and validation rules and messages.
These checks help identify problems with how your content is structured and organized within the stack.
The Healthcheck app Content Modeling section results in three categories:
Actions Required:
Areas of Opportunities:
Strengths:
You can click View Details to view the content type, field, and global field related issues in detail. Then, you can edit and resolve the issue by clicking the respective row or using the edit icon, which will take you to the content type, field, and global field editing page, respectively.
You can download a detailed .xlsx report for the Content Modeling category by clicking the Export XLSX button.
Additional Resource: For more information, refer to the Content Modeling and Content Types documentation.
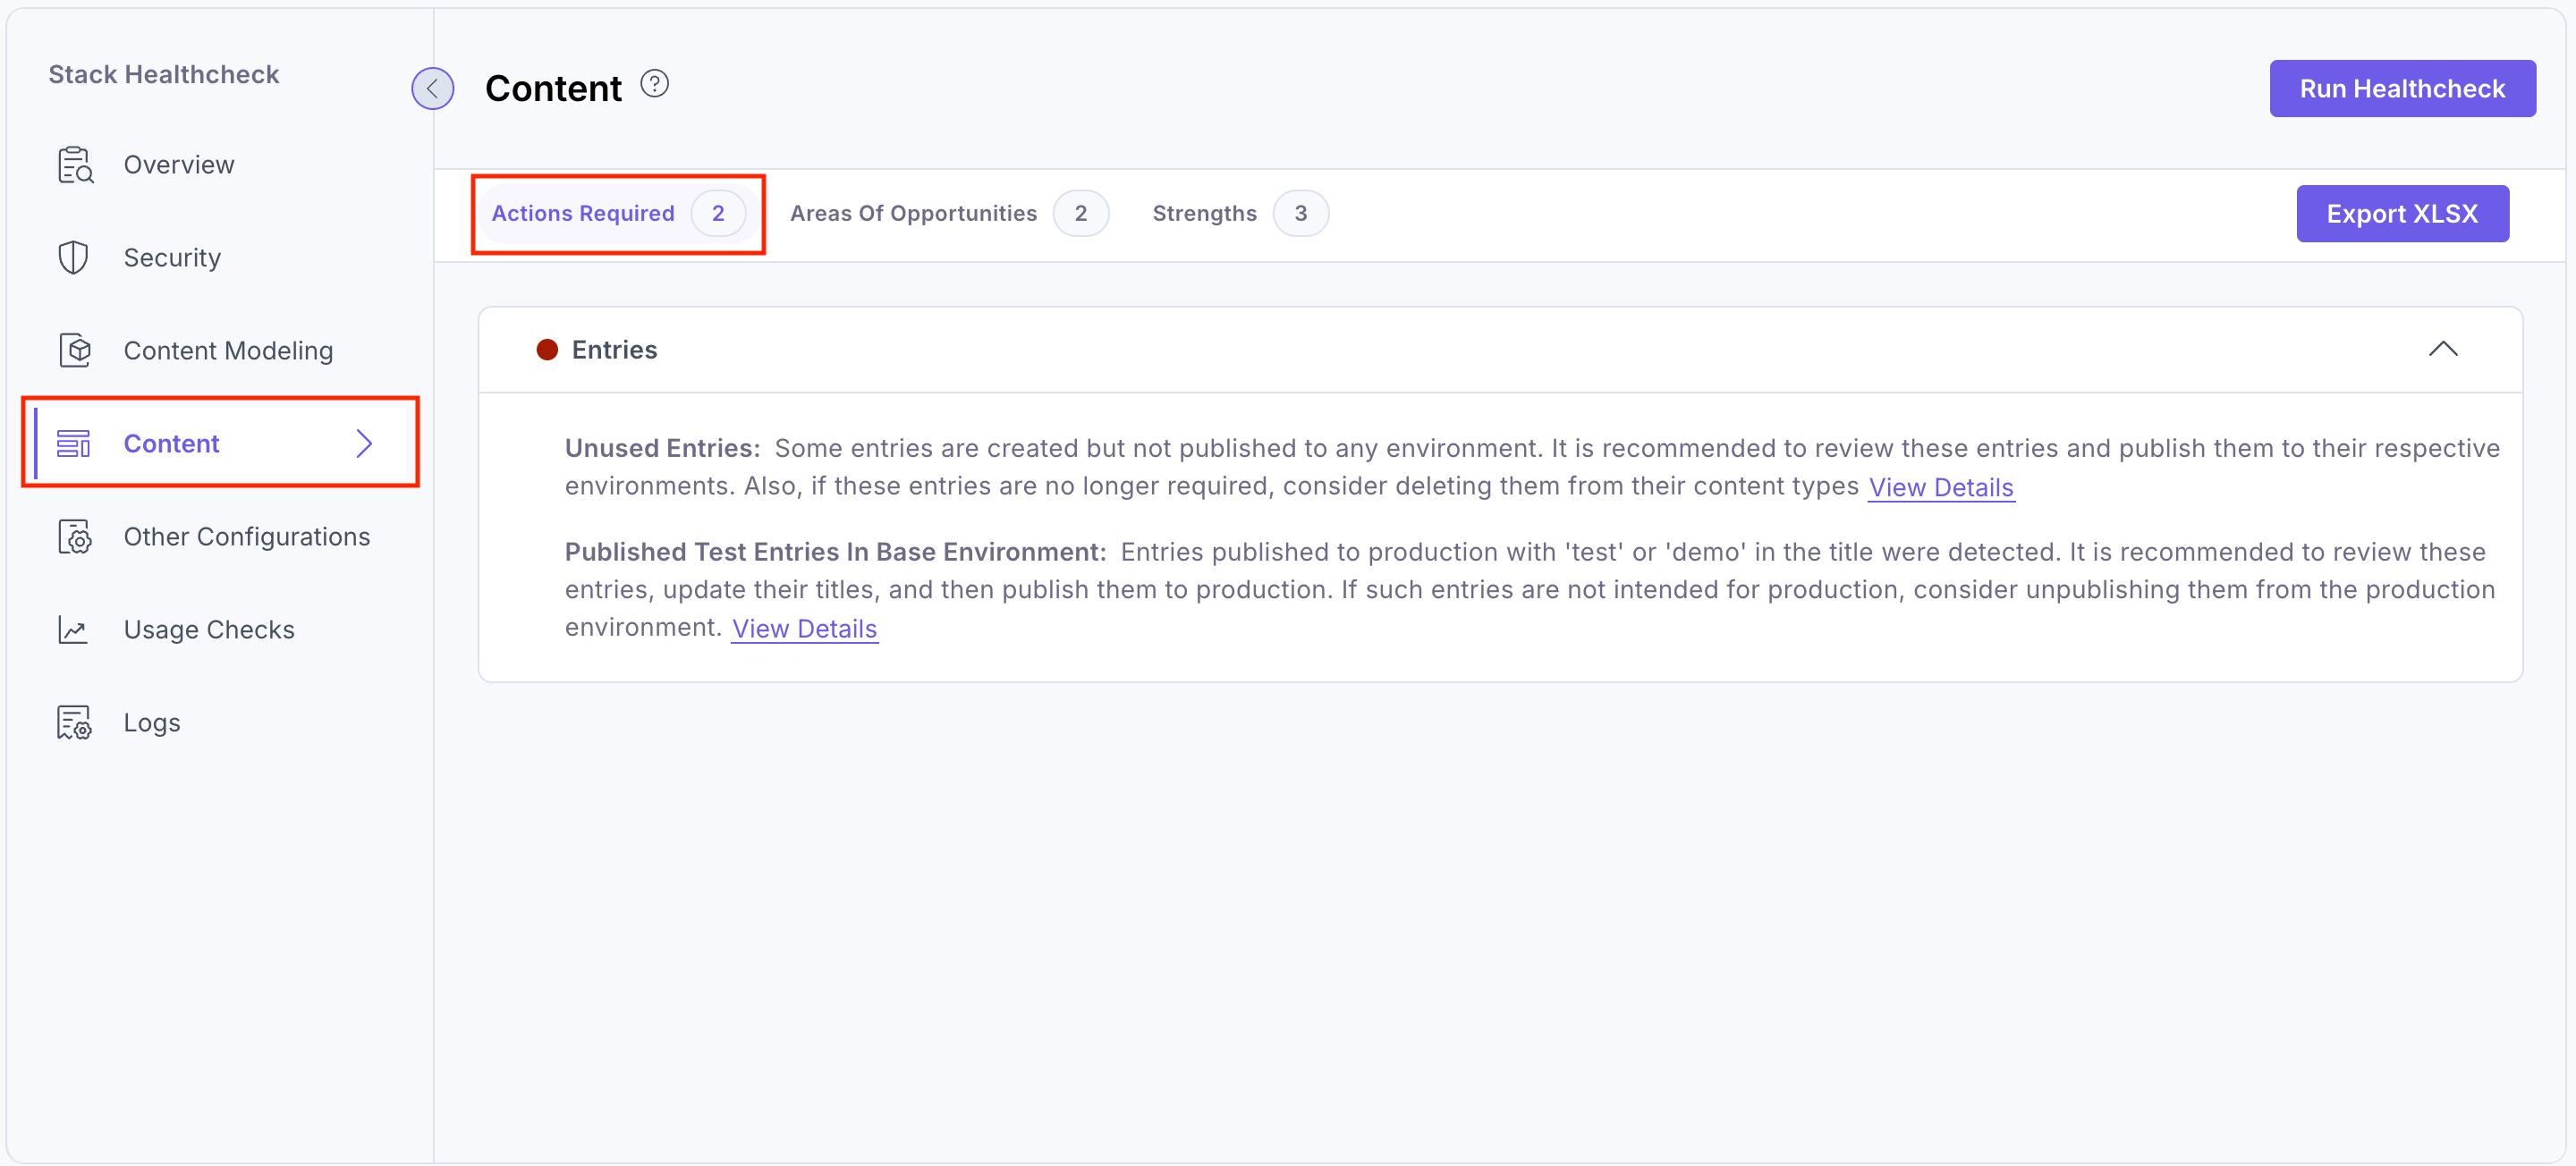
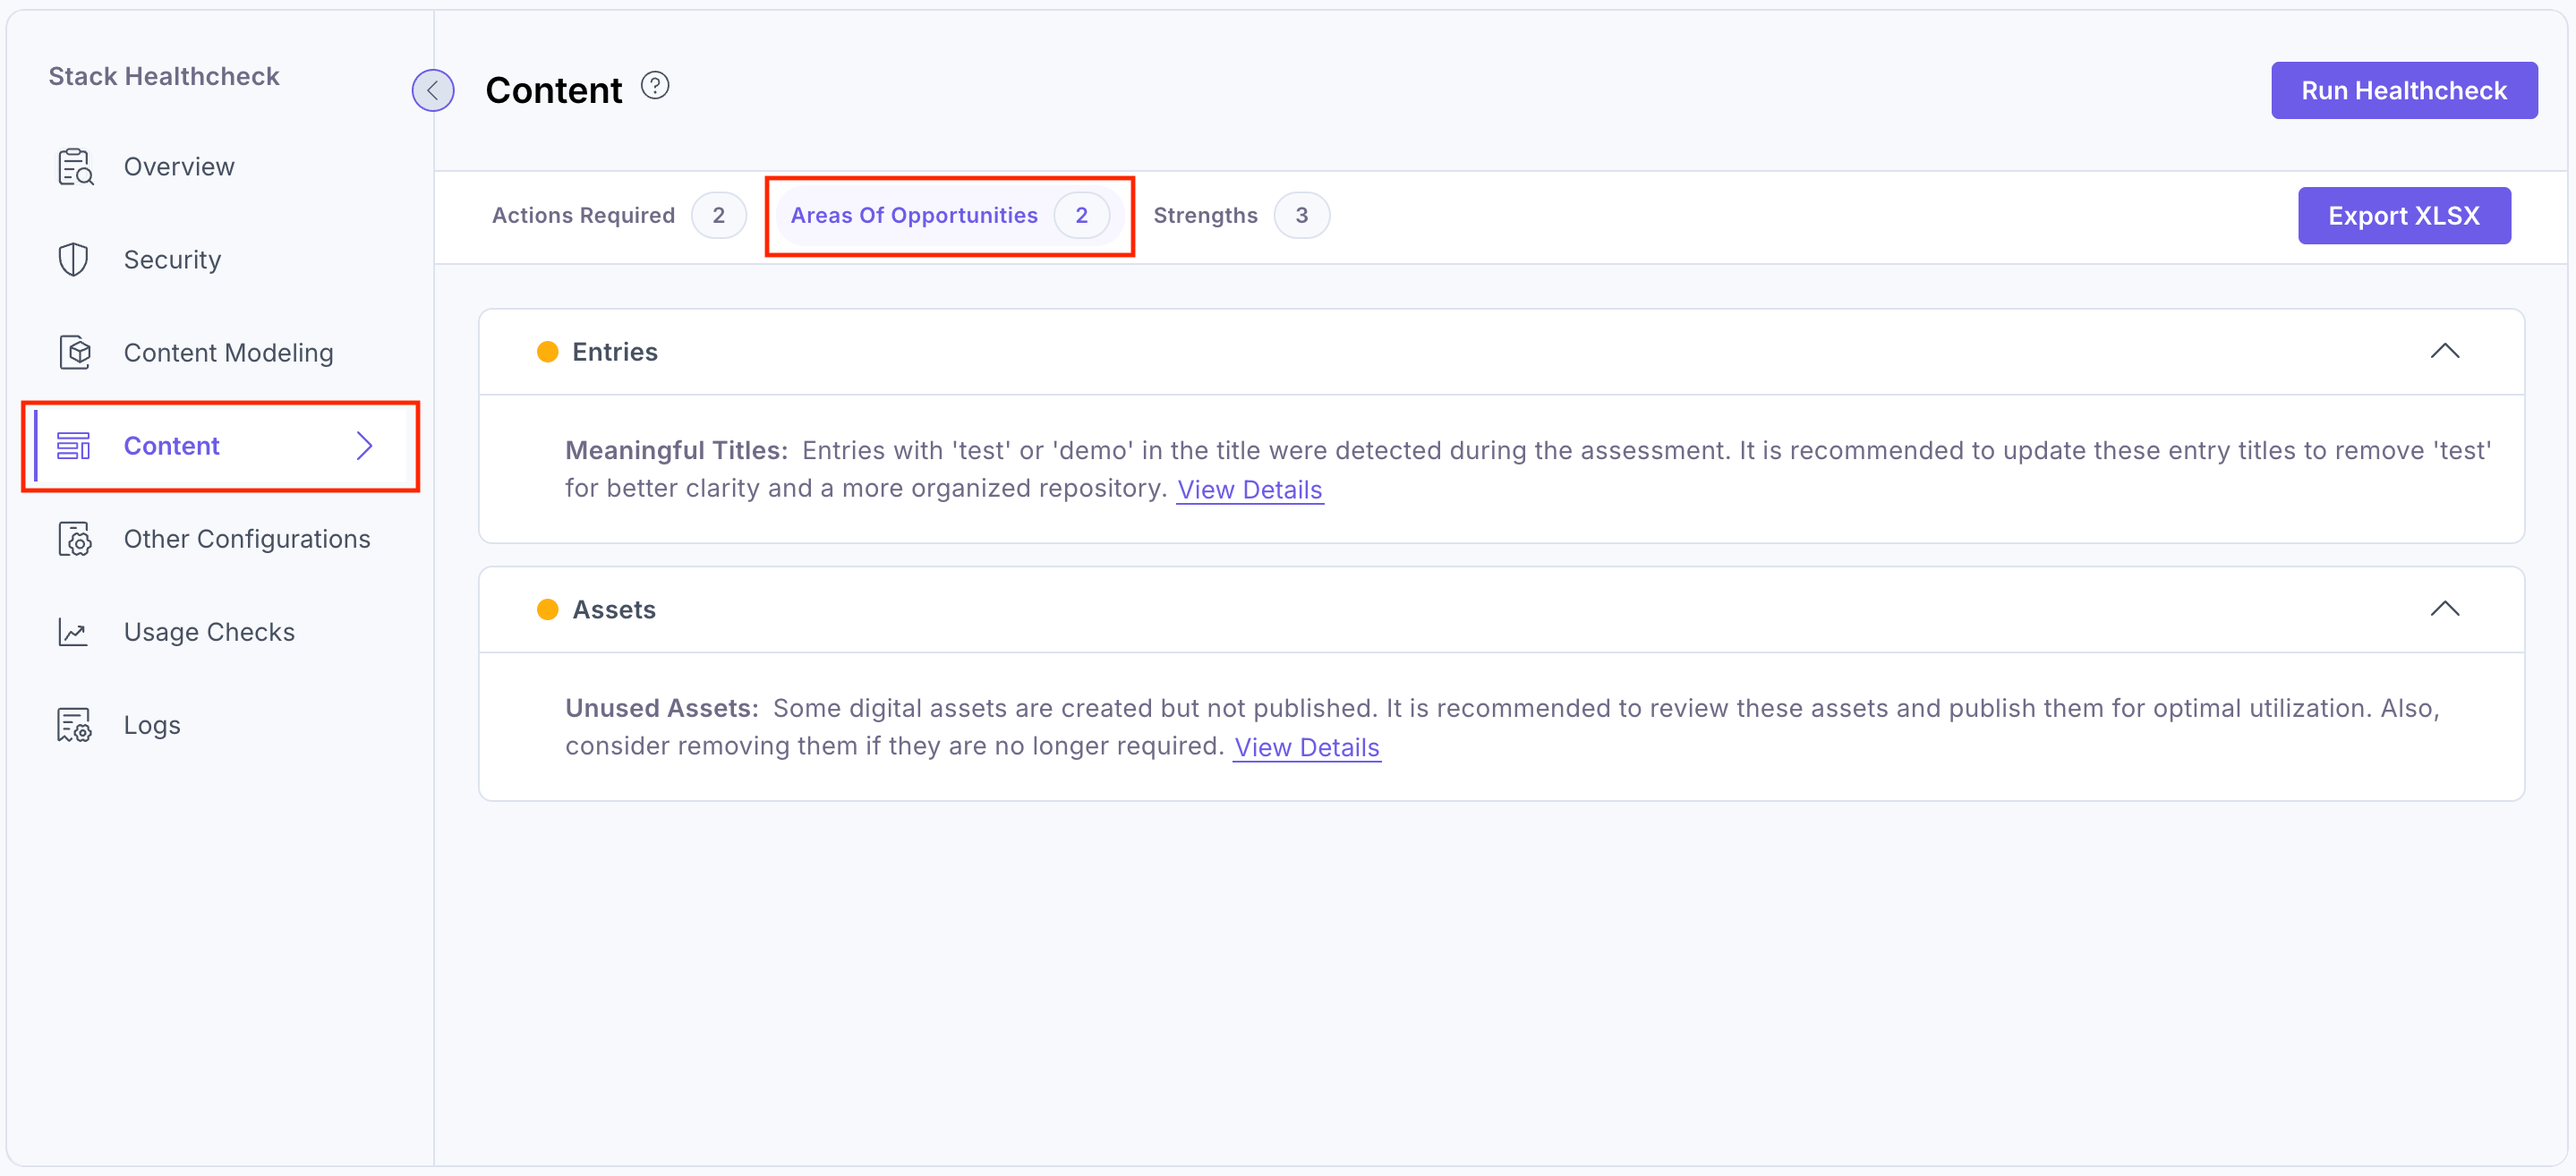
Content
Under the Content tab, you will see the assessment results for Entries and Assets. The Healthcheck app is designed to thoroughly evaluate the health and integrity of the entries content and digital assets managed within the stack.
This includes checks for examining unused entries, test entries, image size optimization, unused digital assets, folders, and uploaded template files (i.e. .md, .css, etc) in assets.
By performing these content-centric checks, the Healthcheck app provides valuable insights, empowering users and administrators to identify and address any issues or discrepancies that may arise. This helps maintain the reliability, consistency, and performance of your stack.
The Healthcheck app Content section results in three categories:
Actions Required:
Areas of Opportunities:
Strengths:
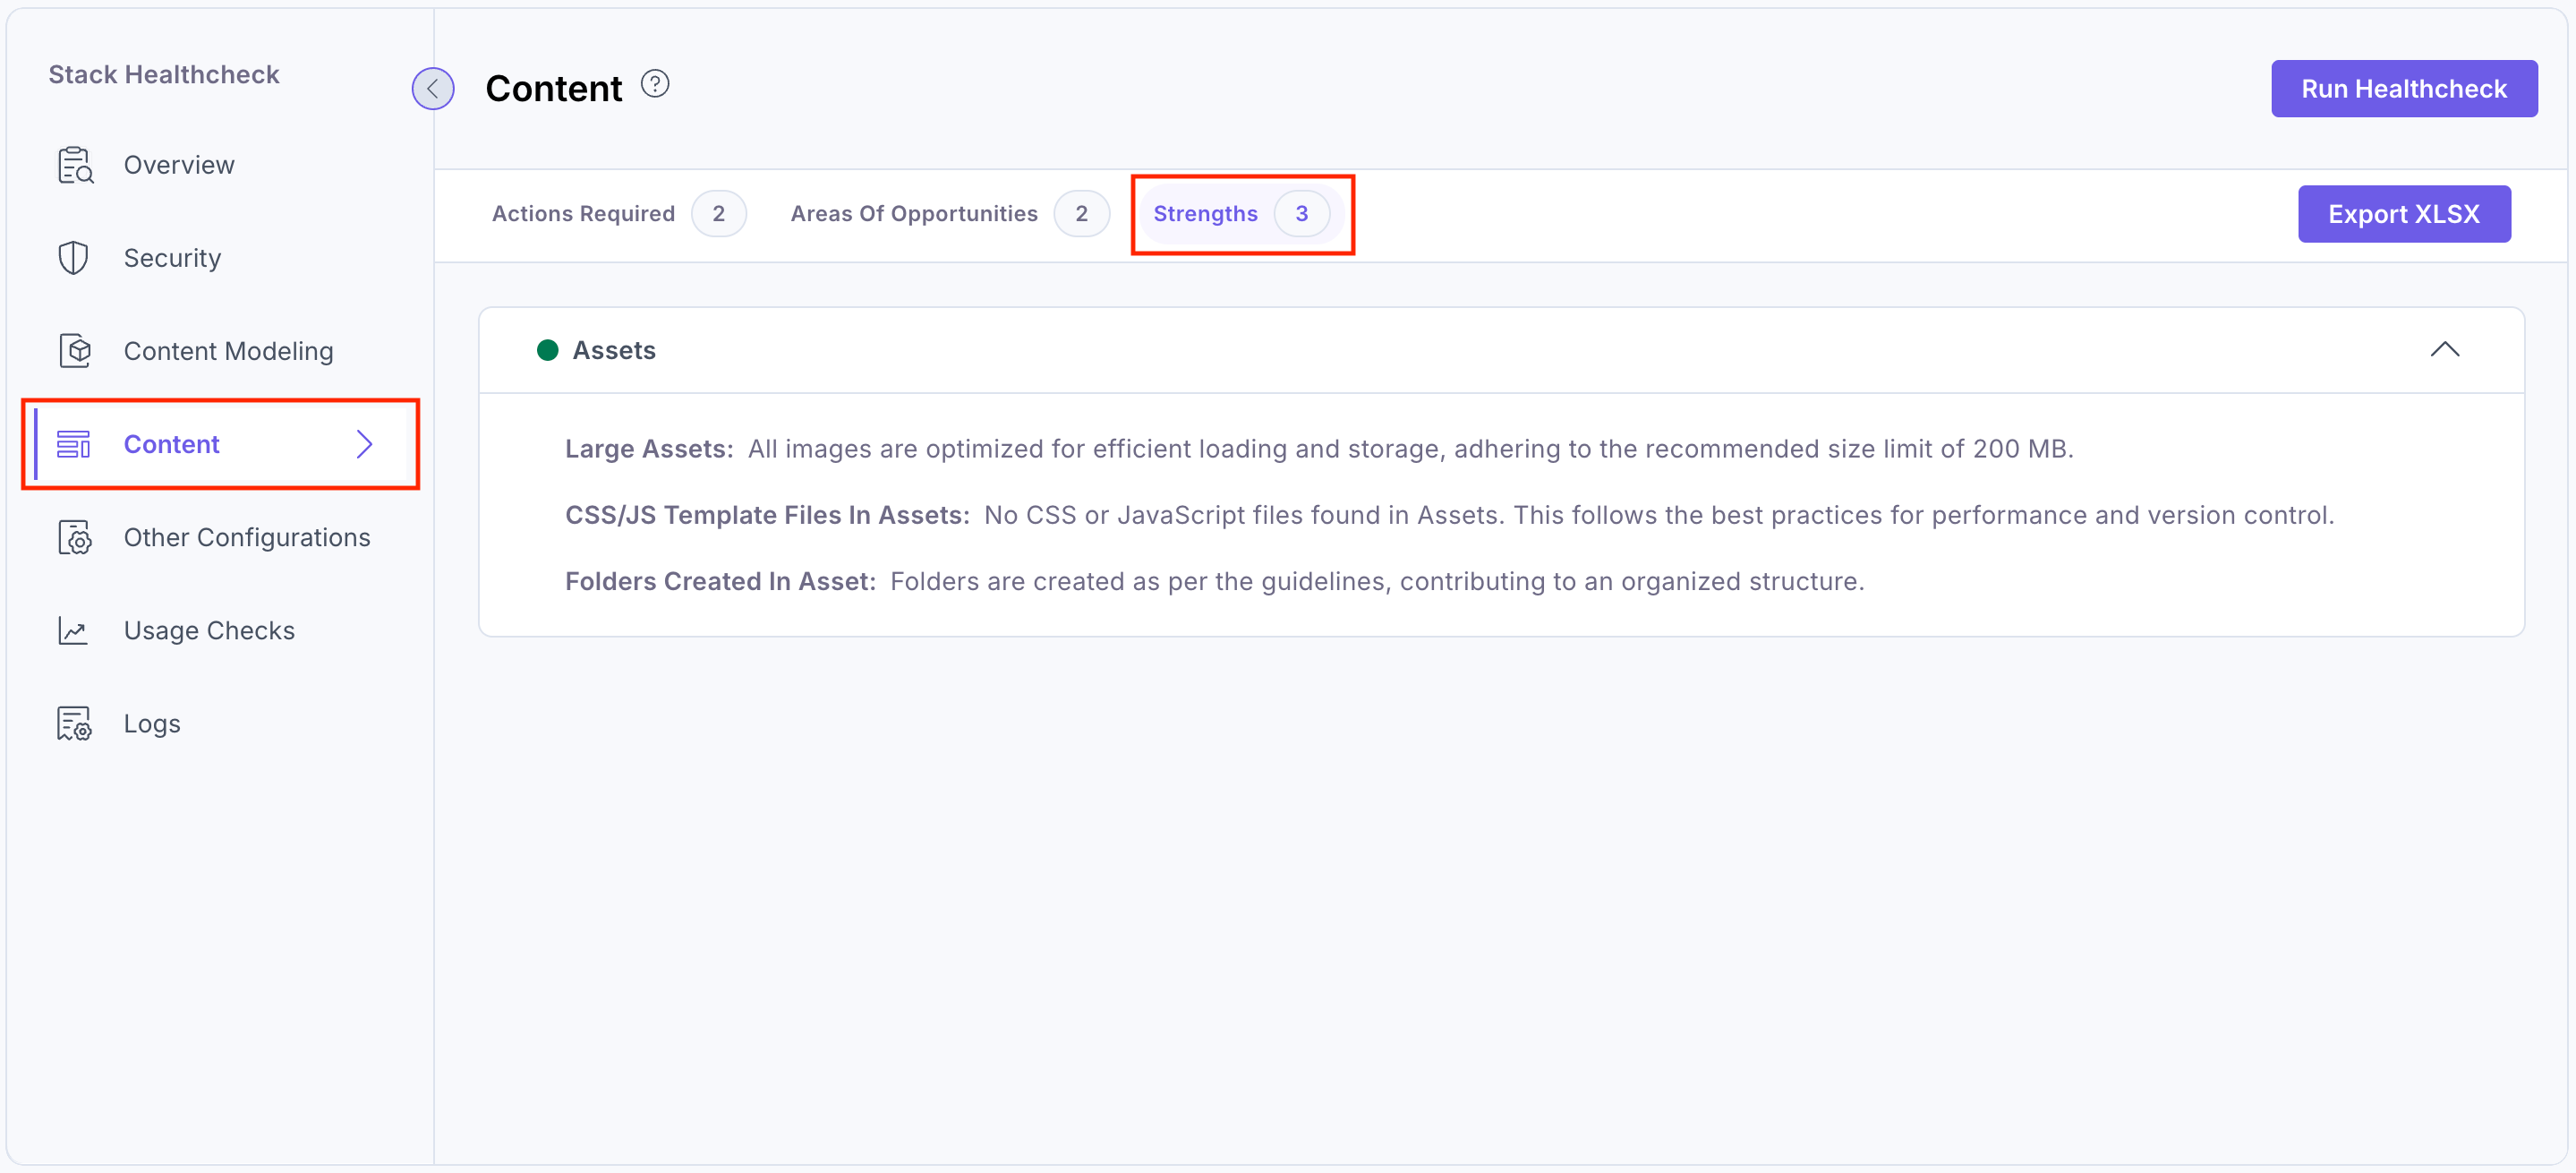
You can click View Details to view the entries and assets issue in detail. Then, you can edit and resolve the issue by clicking the respective row or using the edit icon, which will take you to your stack settings.
You can download a detailed .xlsx report for the Content category by clicking the Export XLSX button.
Additional Resource: For more information, refer to the Entries and Assets documentation.
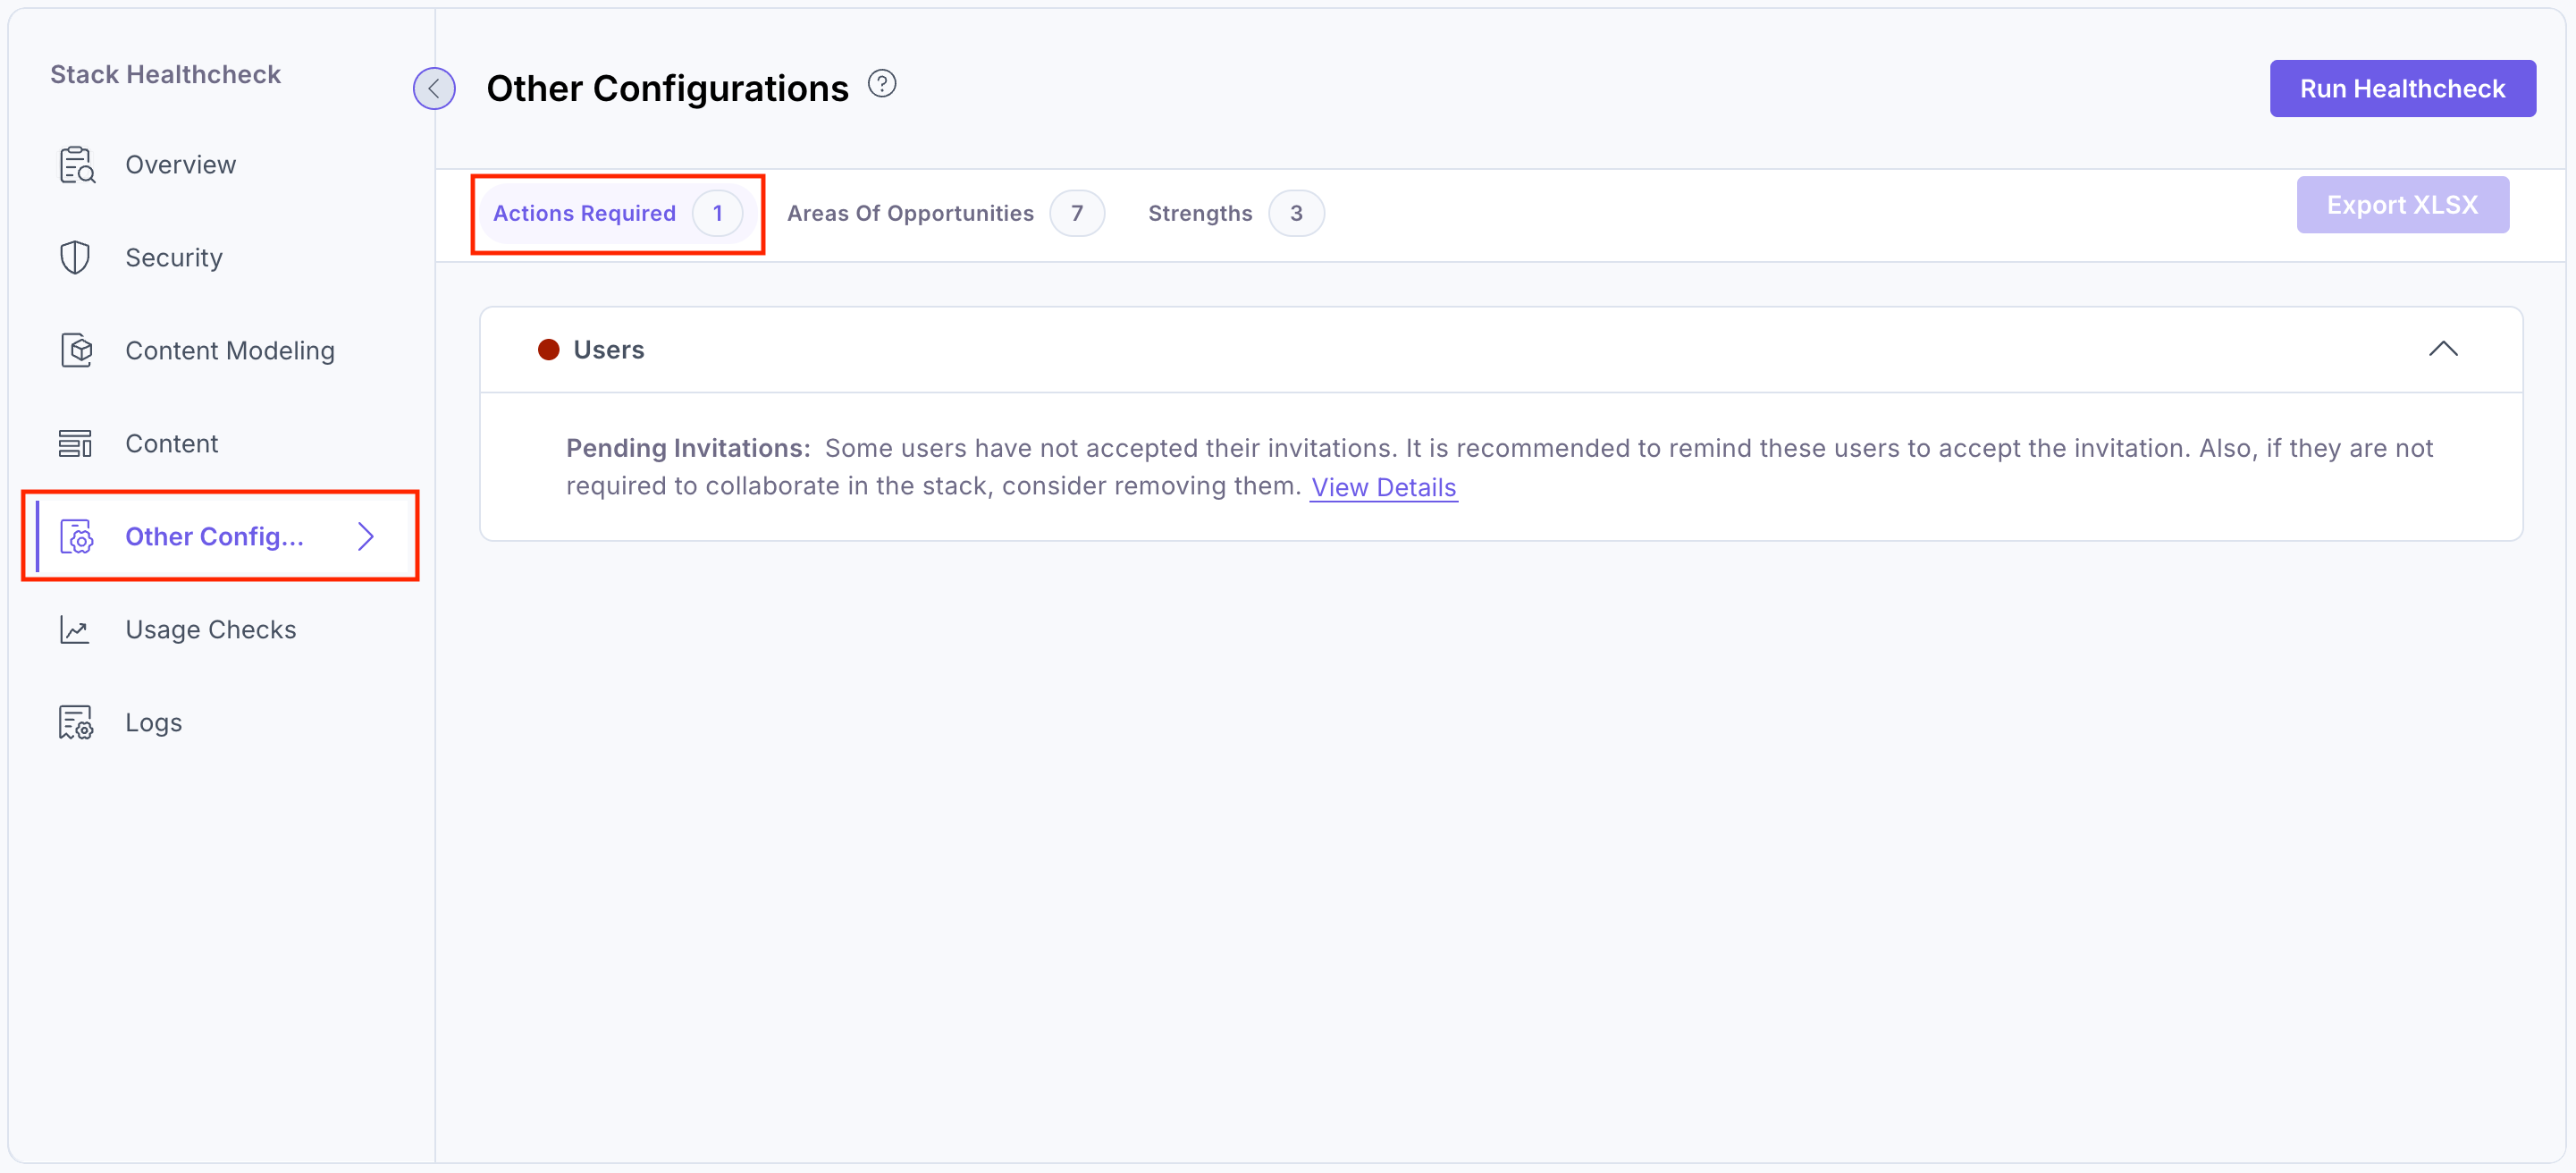
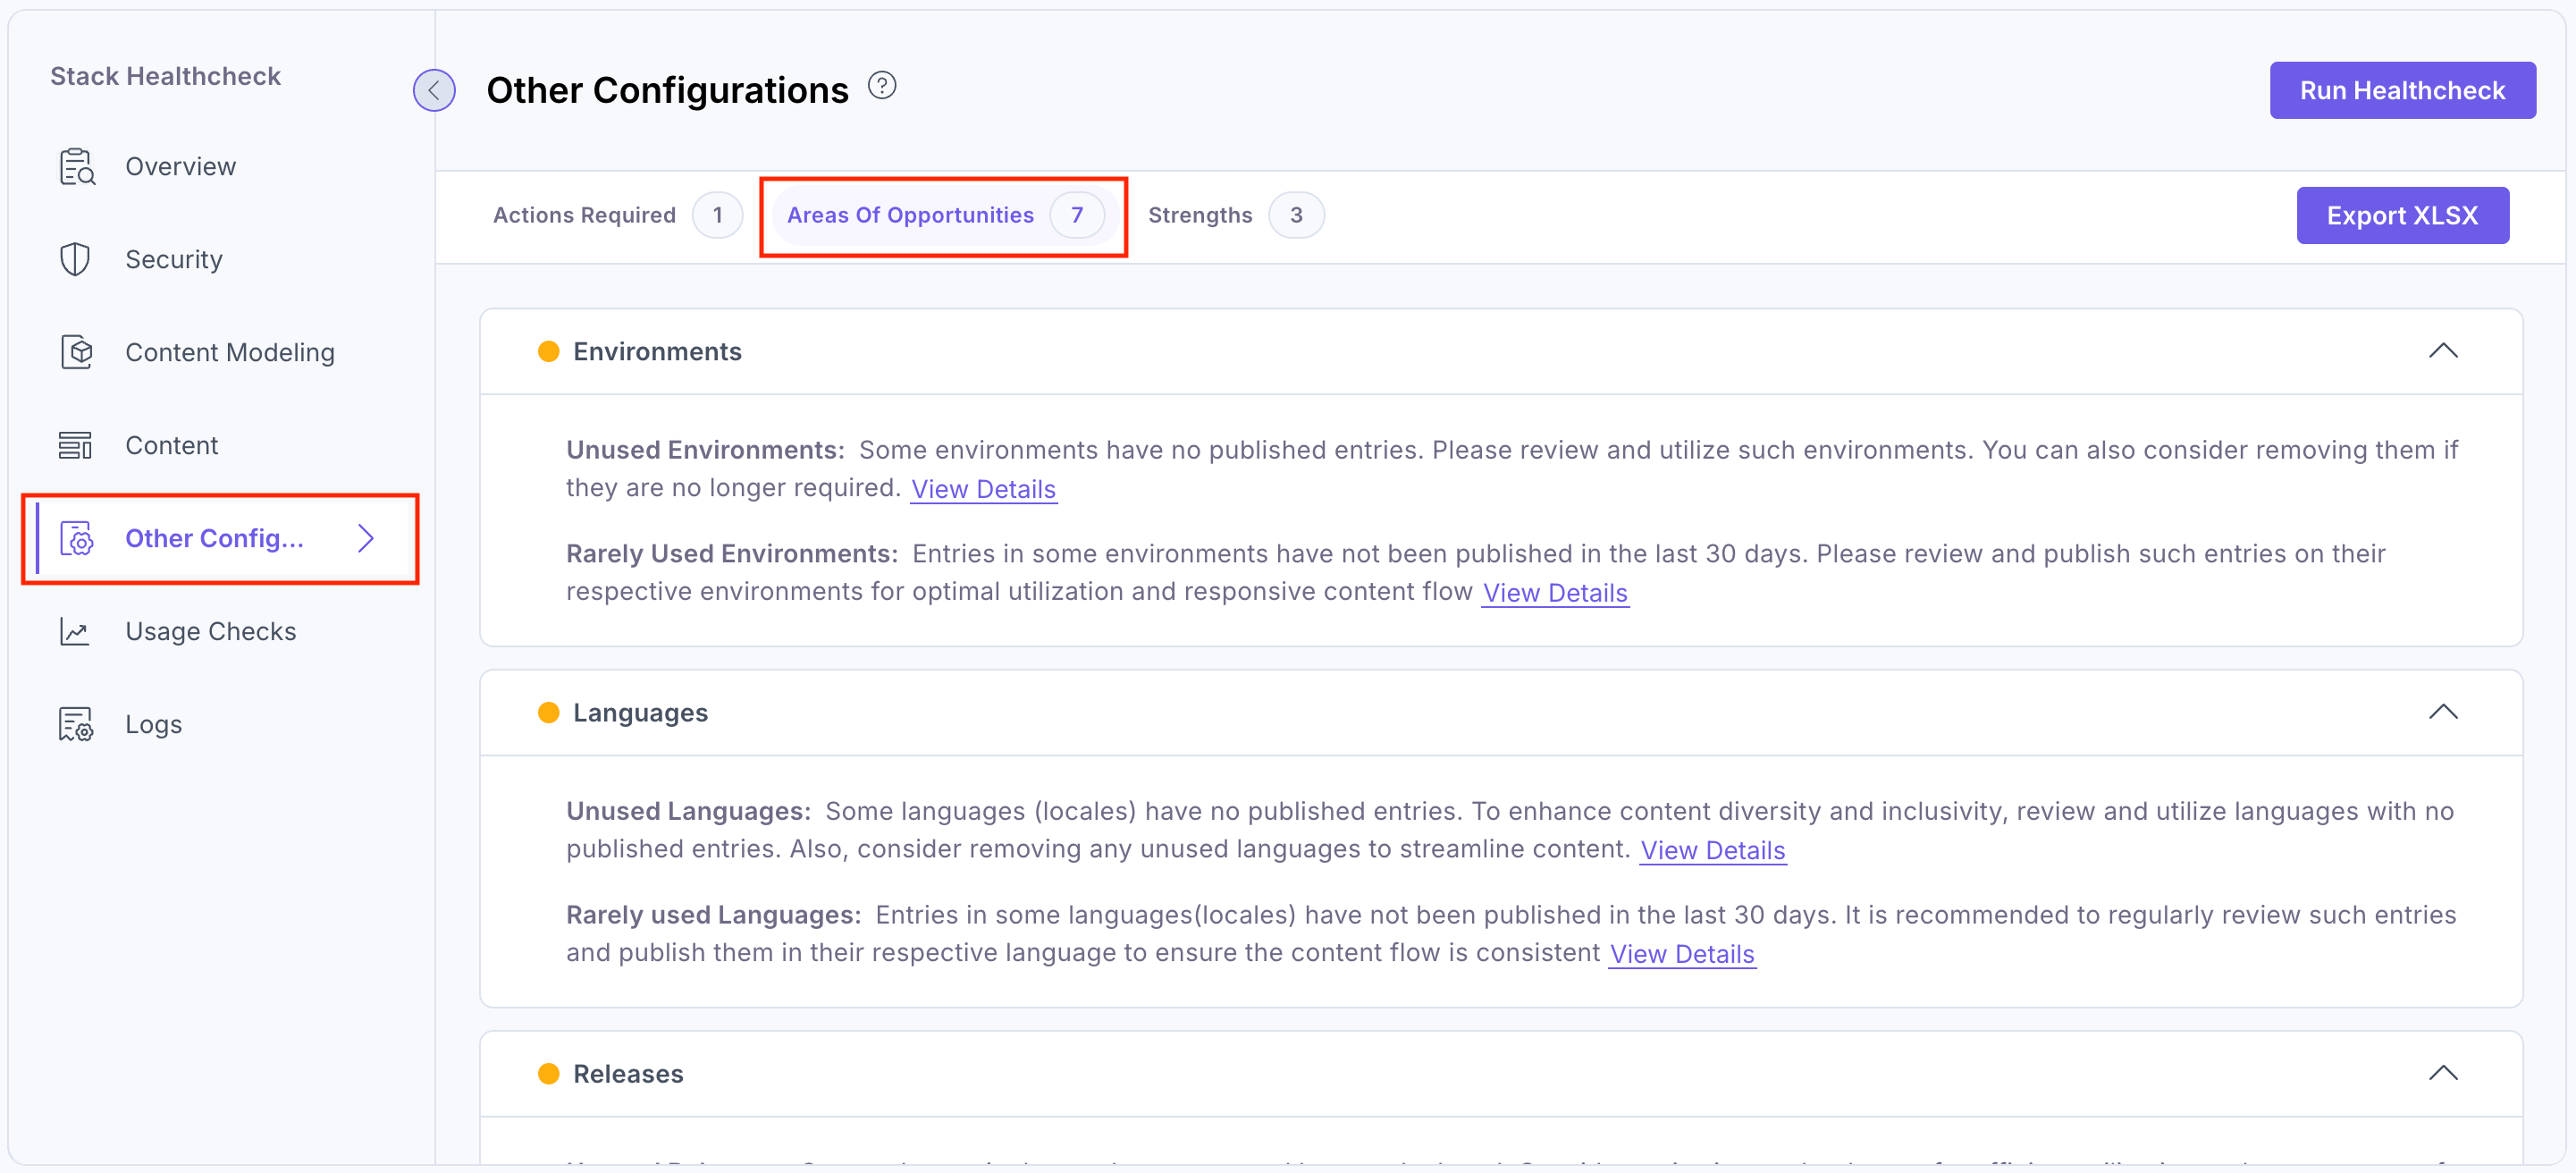
Other Configurations
Under the Other Configurations tab, the Healthcheck app also checks for configurations related to Webhooks, Environments, Workflows, Releases, Locales, Users, Custom User Roles, Extensions, and more. These additional checks help ensure your stack's overall performance and proper functioning.
The Healthcheck app Other Configurations section results in three categories:
Actions Required:
Areas of Opportunities:
Strengths:
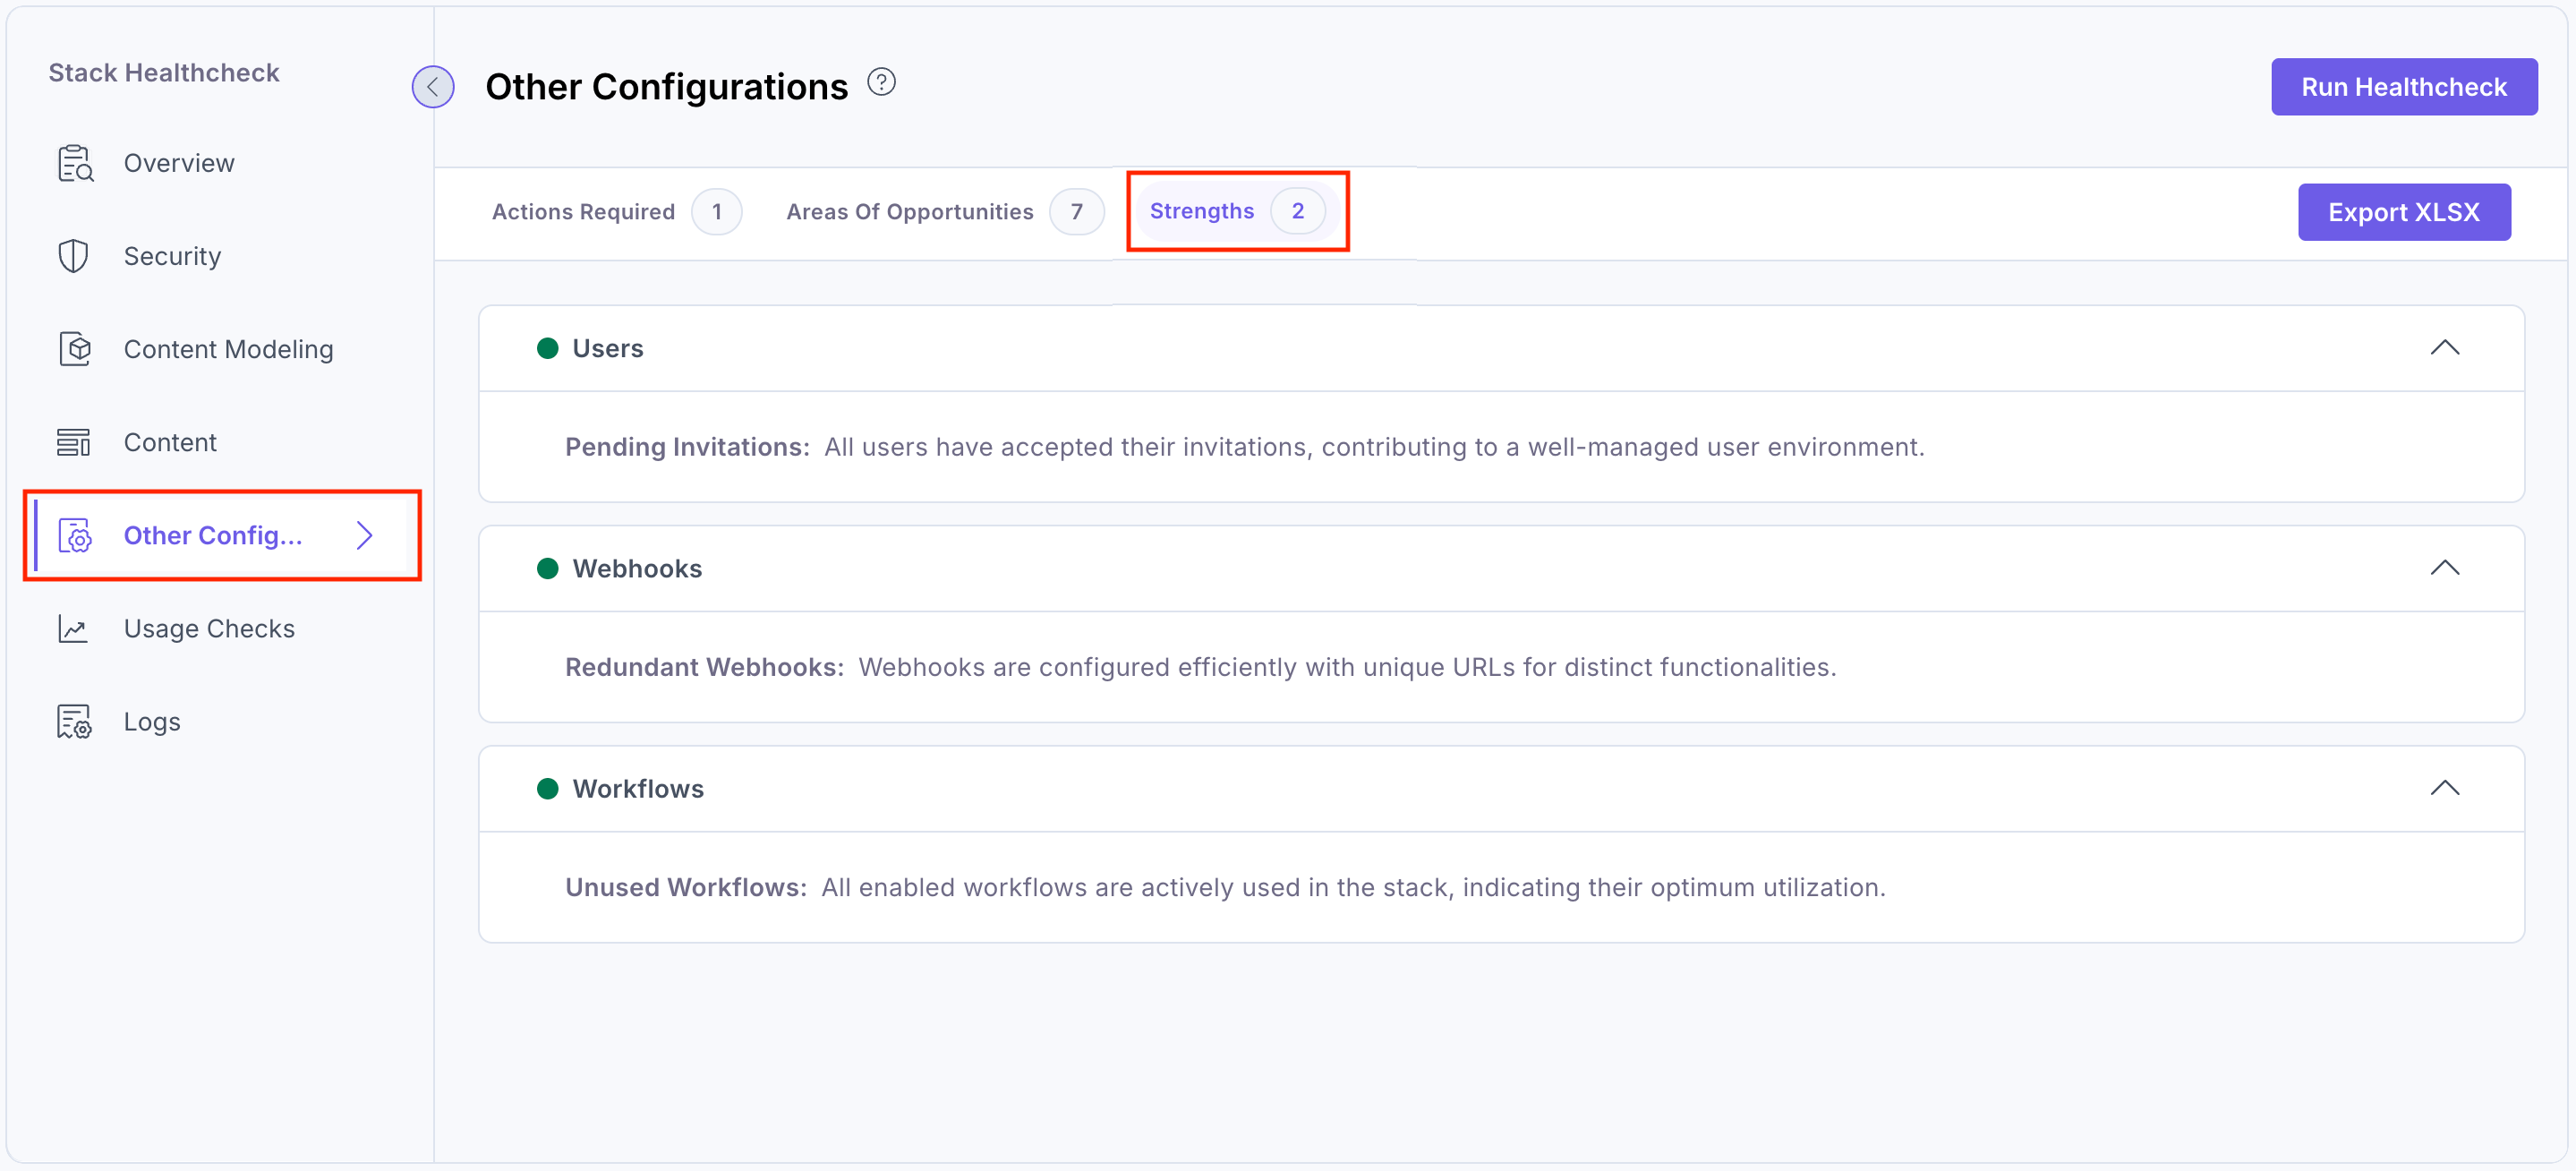
You can click View Details to view the issue in detail. Then, you can edit and resolve the issue by clicking the respective row or using the edit icon, which will take you to your stack settings.
You can download a detailed .xlsx report for the Other Configurations category by clicking the Export XLSX button.
Additional Resource: For more information, refer to the Contentstack documentation.
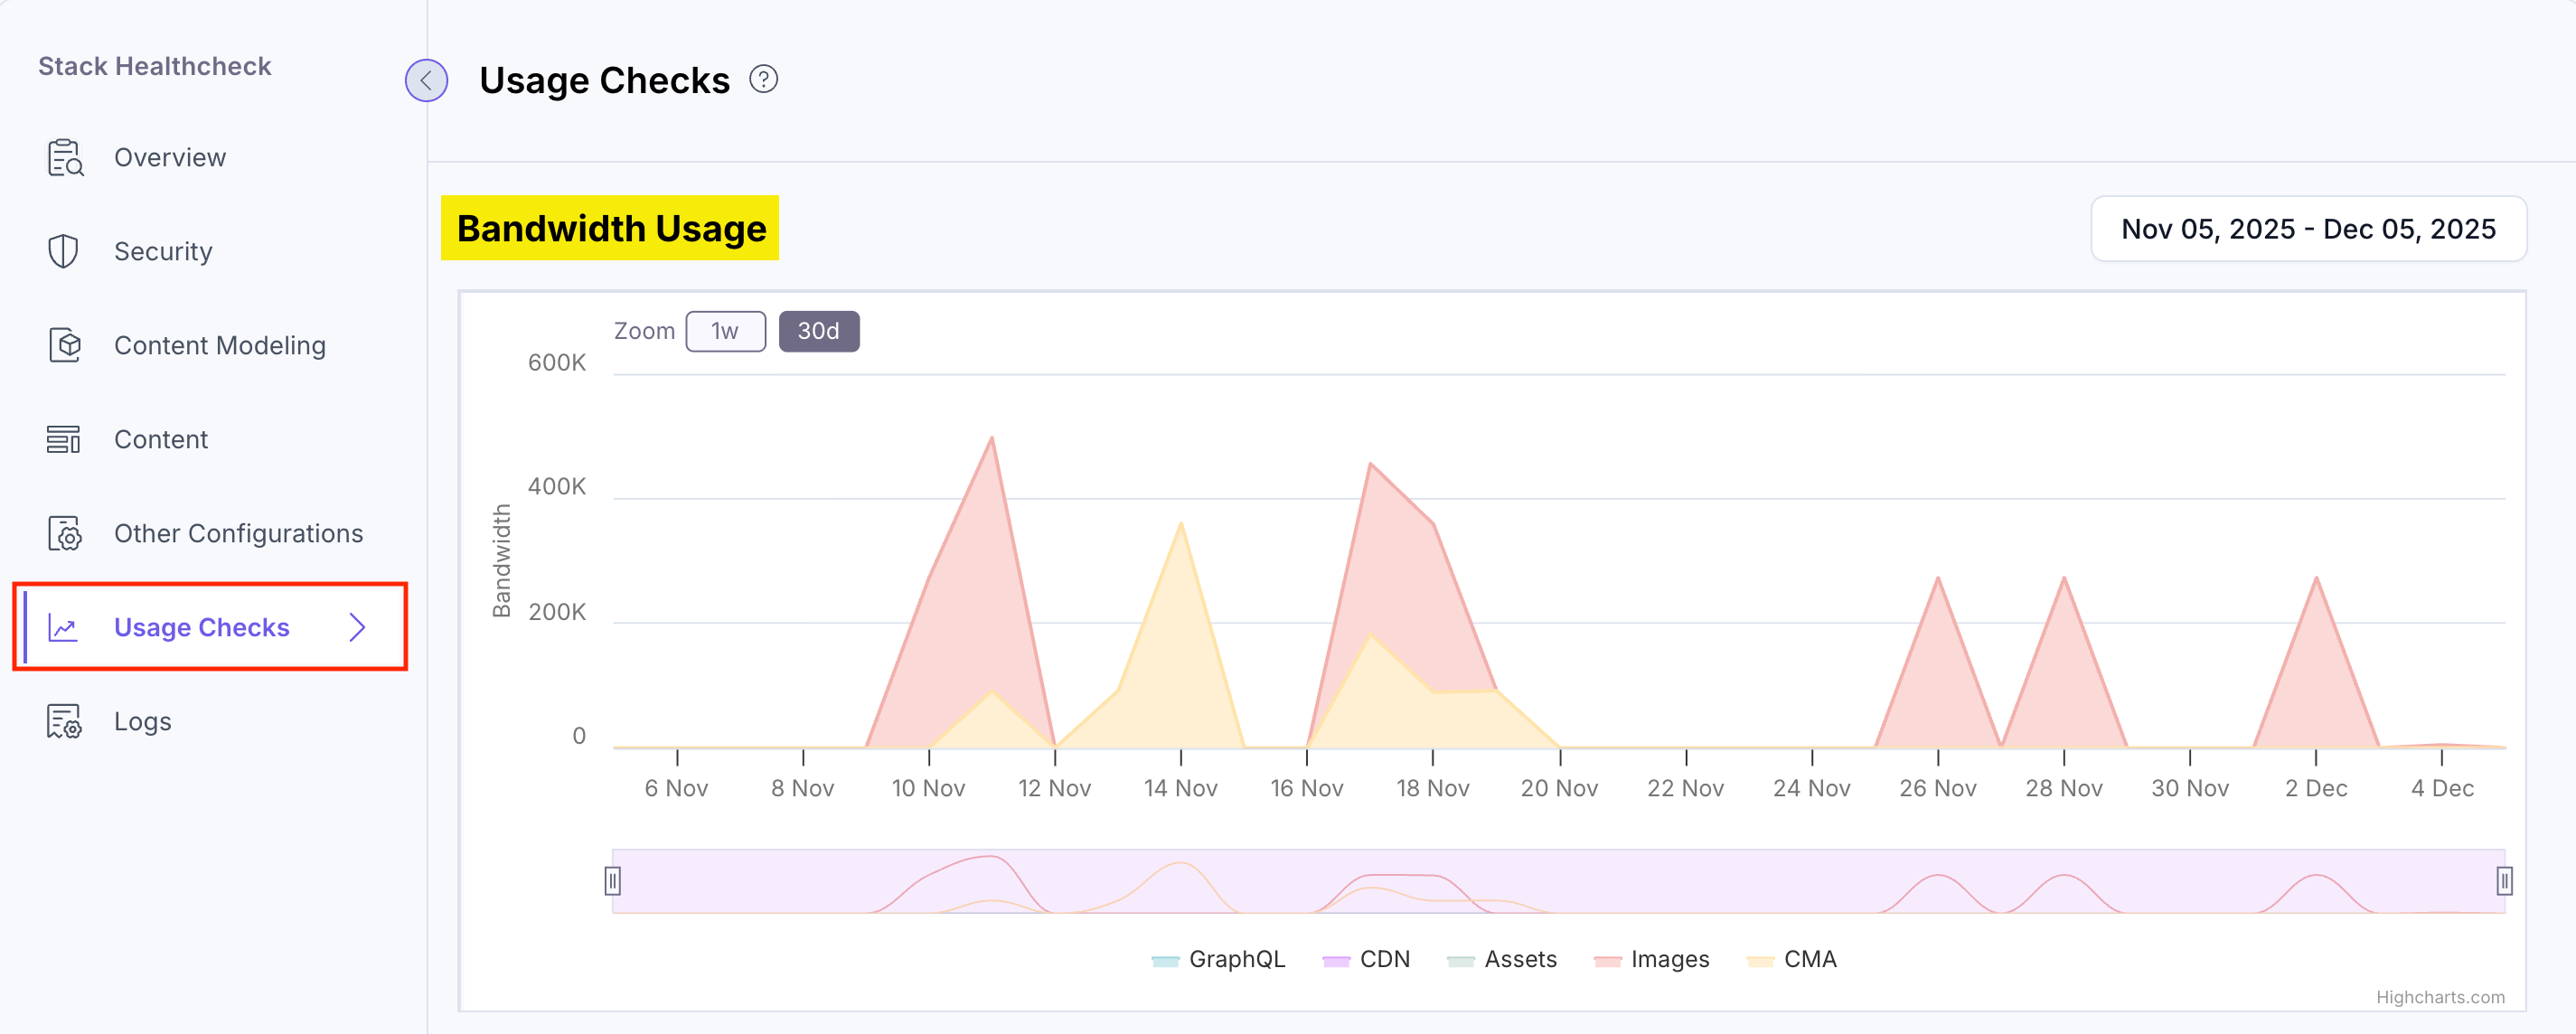
Usage Checks
Under the Usage Checks tab, you can view the detailed analytics on bandwidth usage, top API URLs, status codes, and API activity across GraphQL, CDN, Assets, Images, and CMA. These insights help teams monitor traffic patterns, identify high-volume endpoints, review response behavior, and understand how different services are being used over time.
The Healthcheck app represents the following statistics:
Bandwidth Usage:
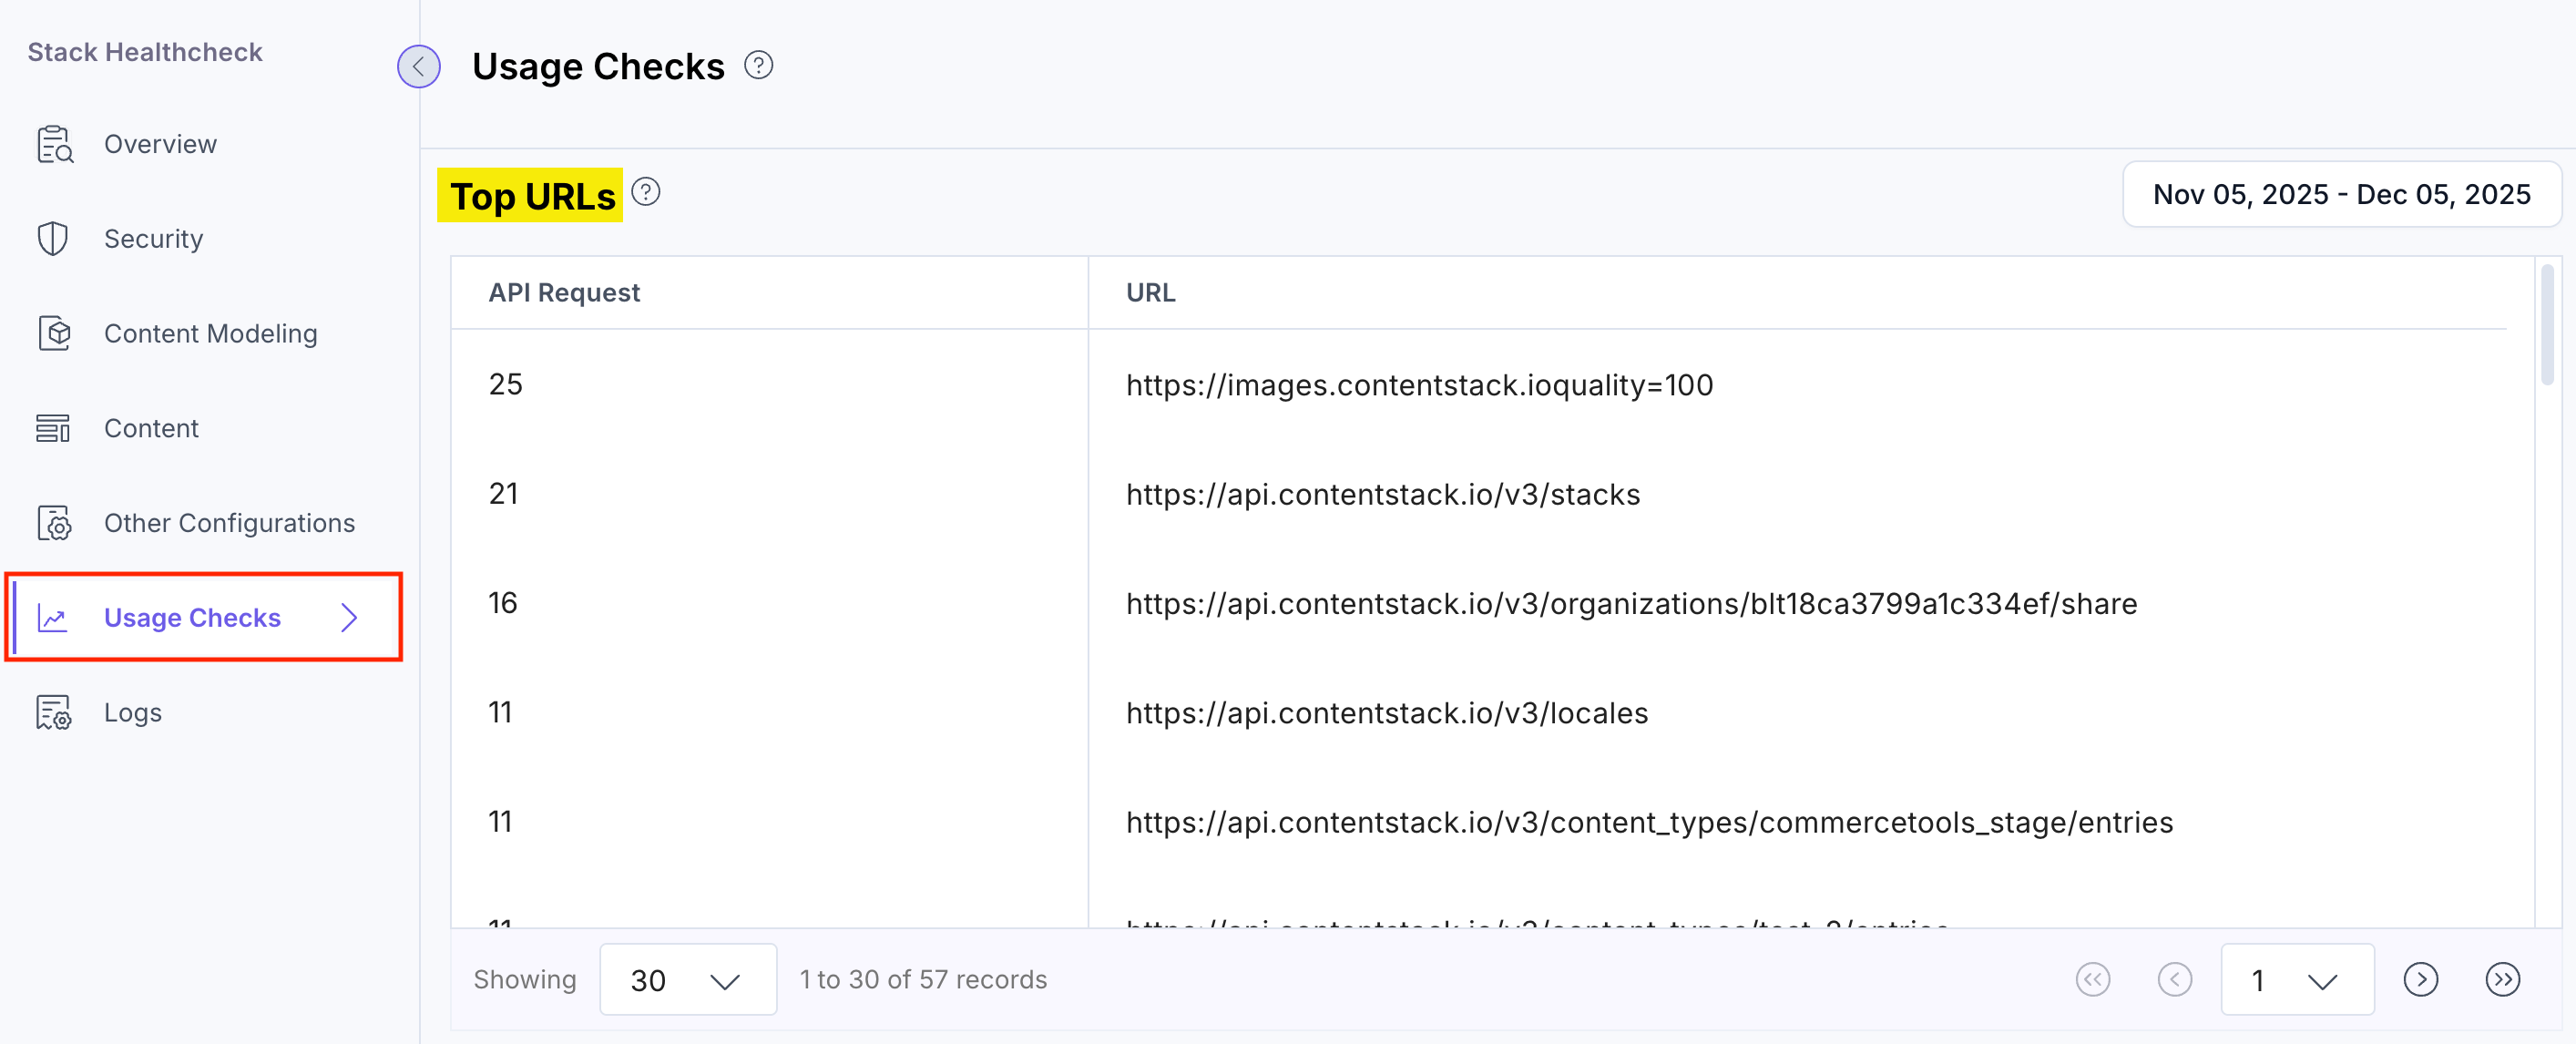
Top URLs:
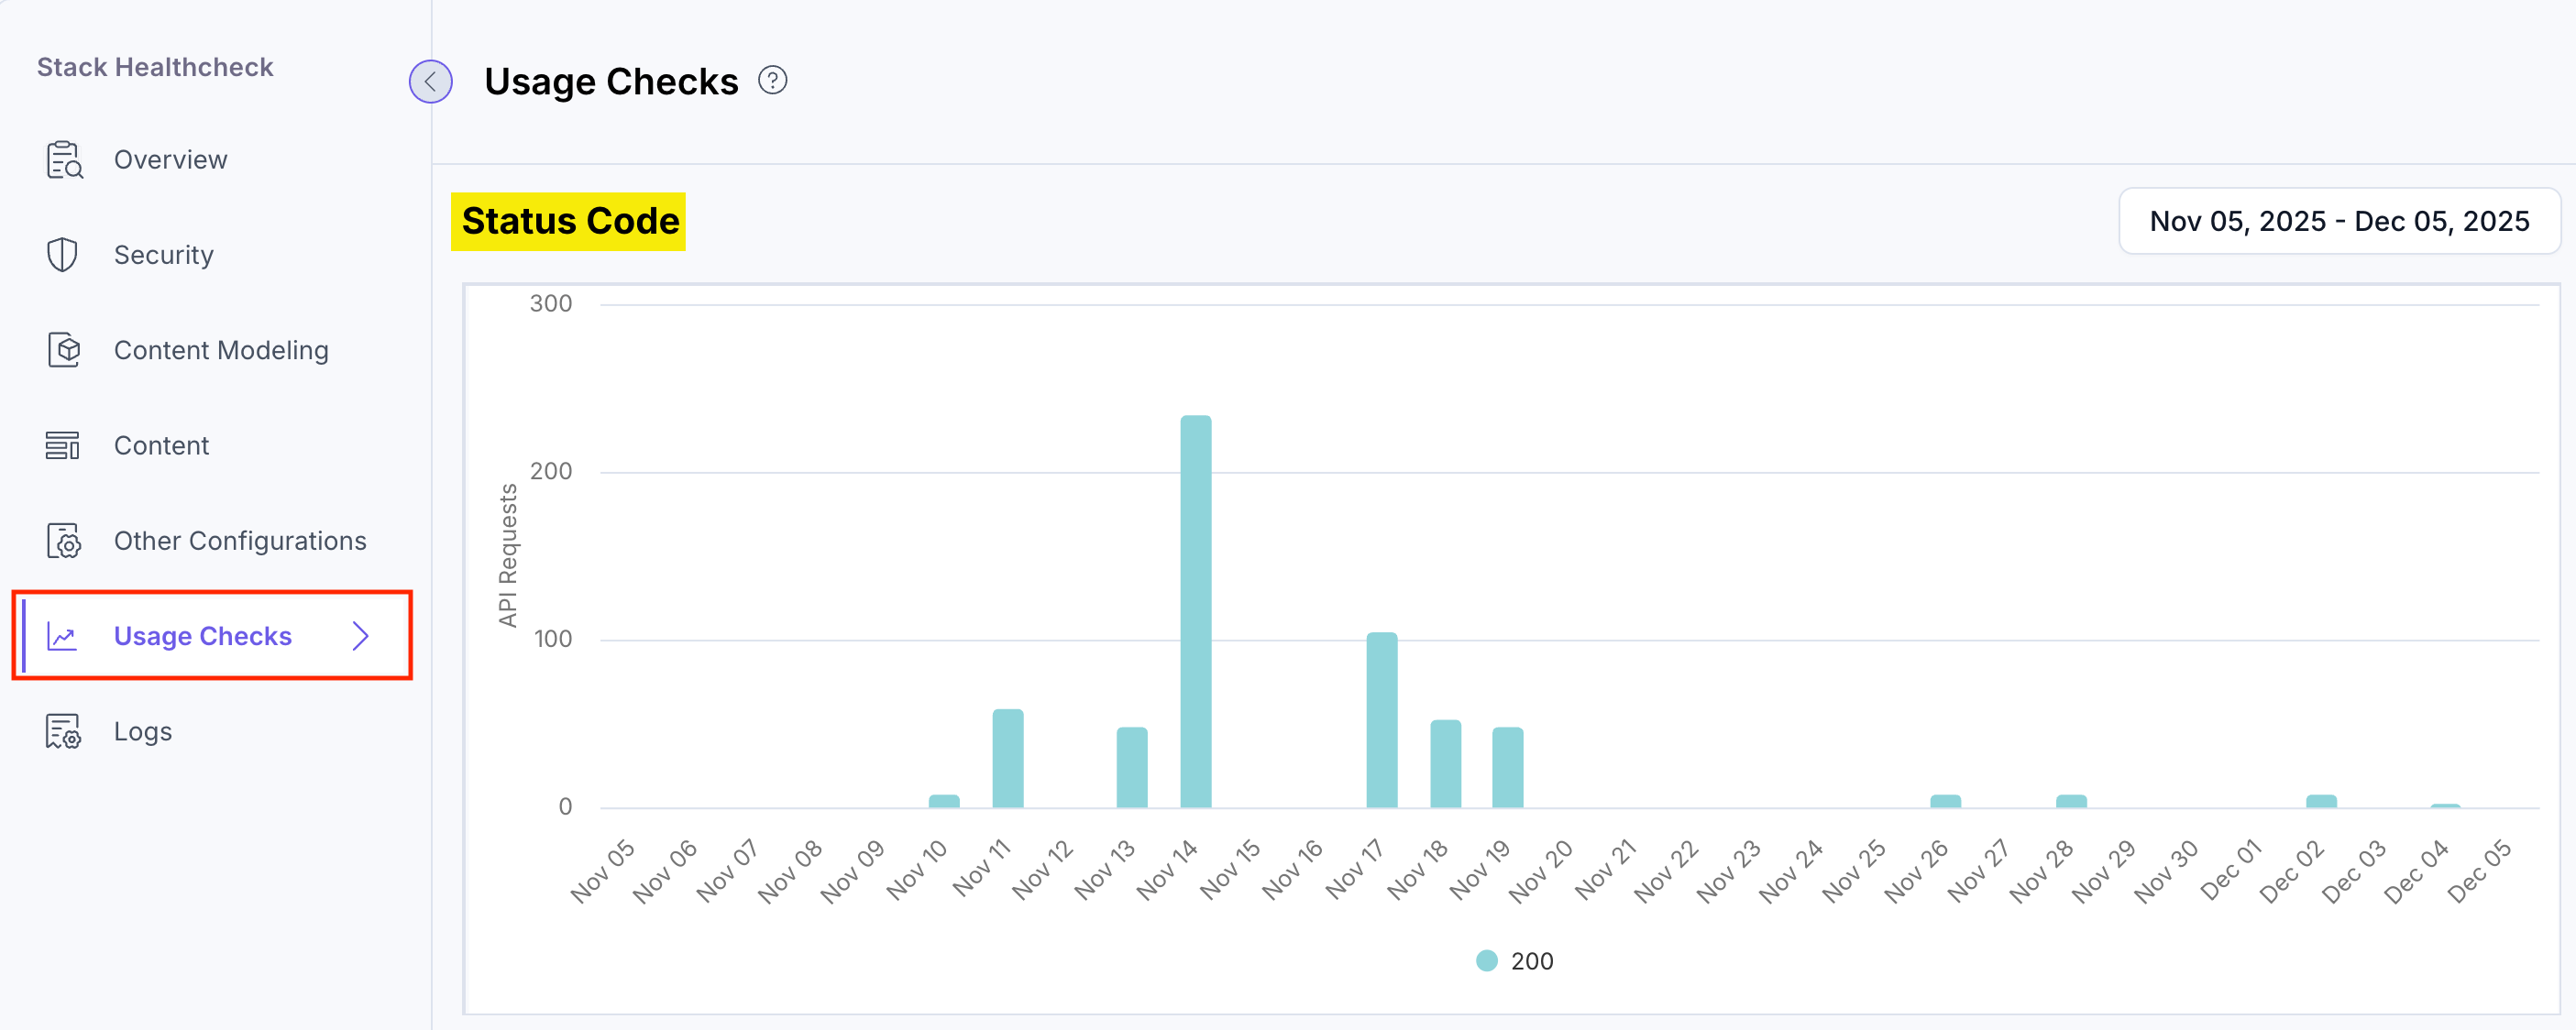
Status Code:
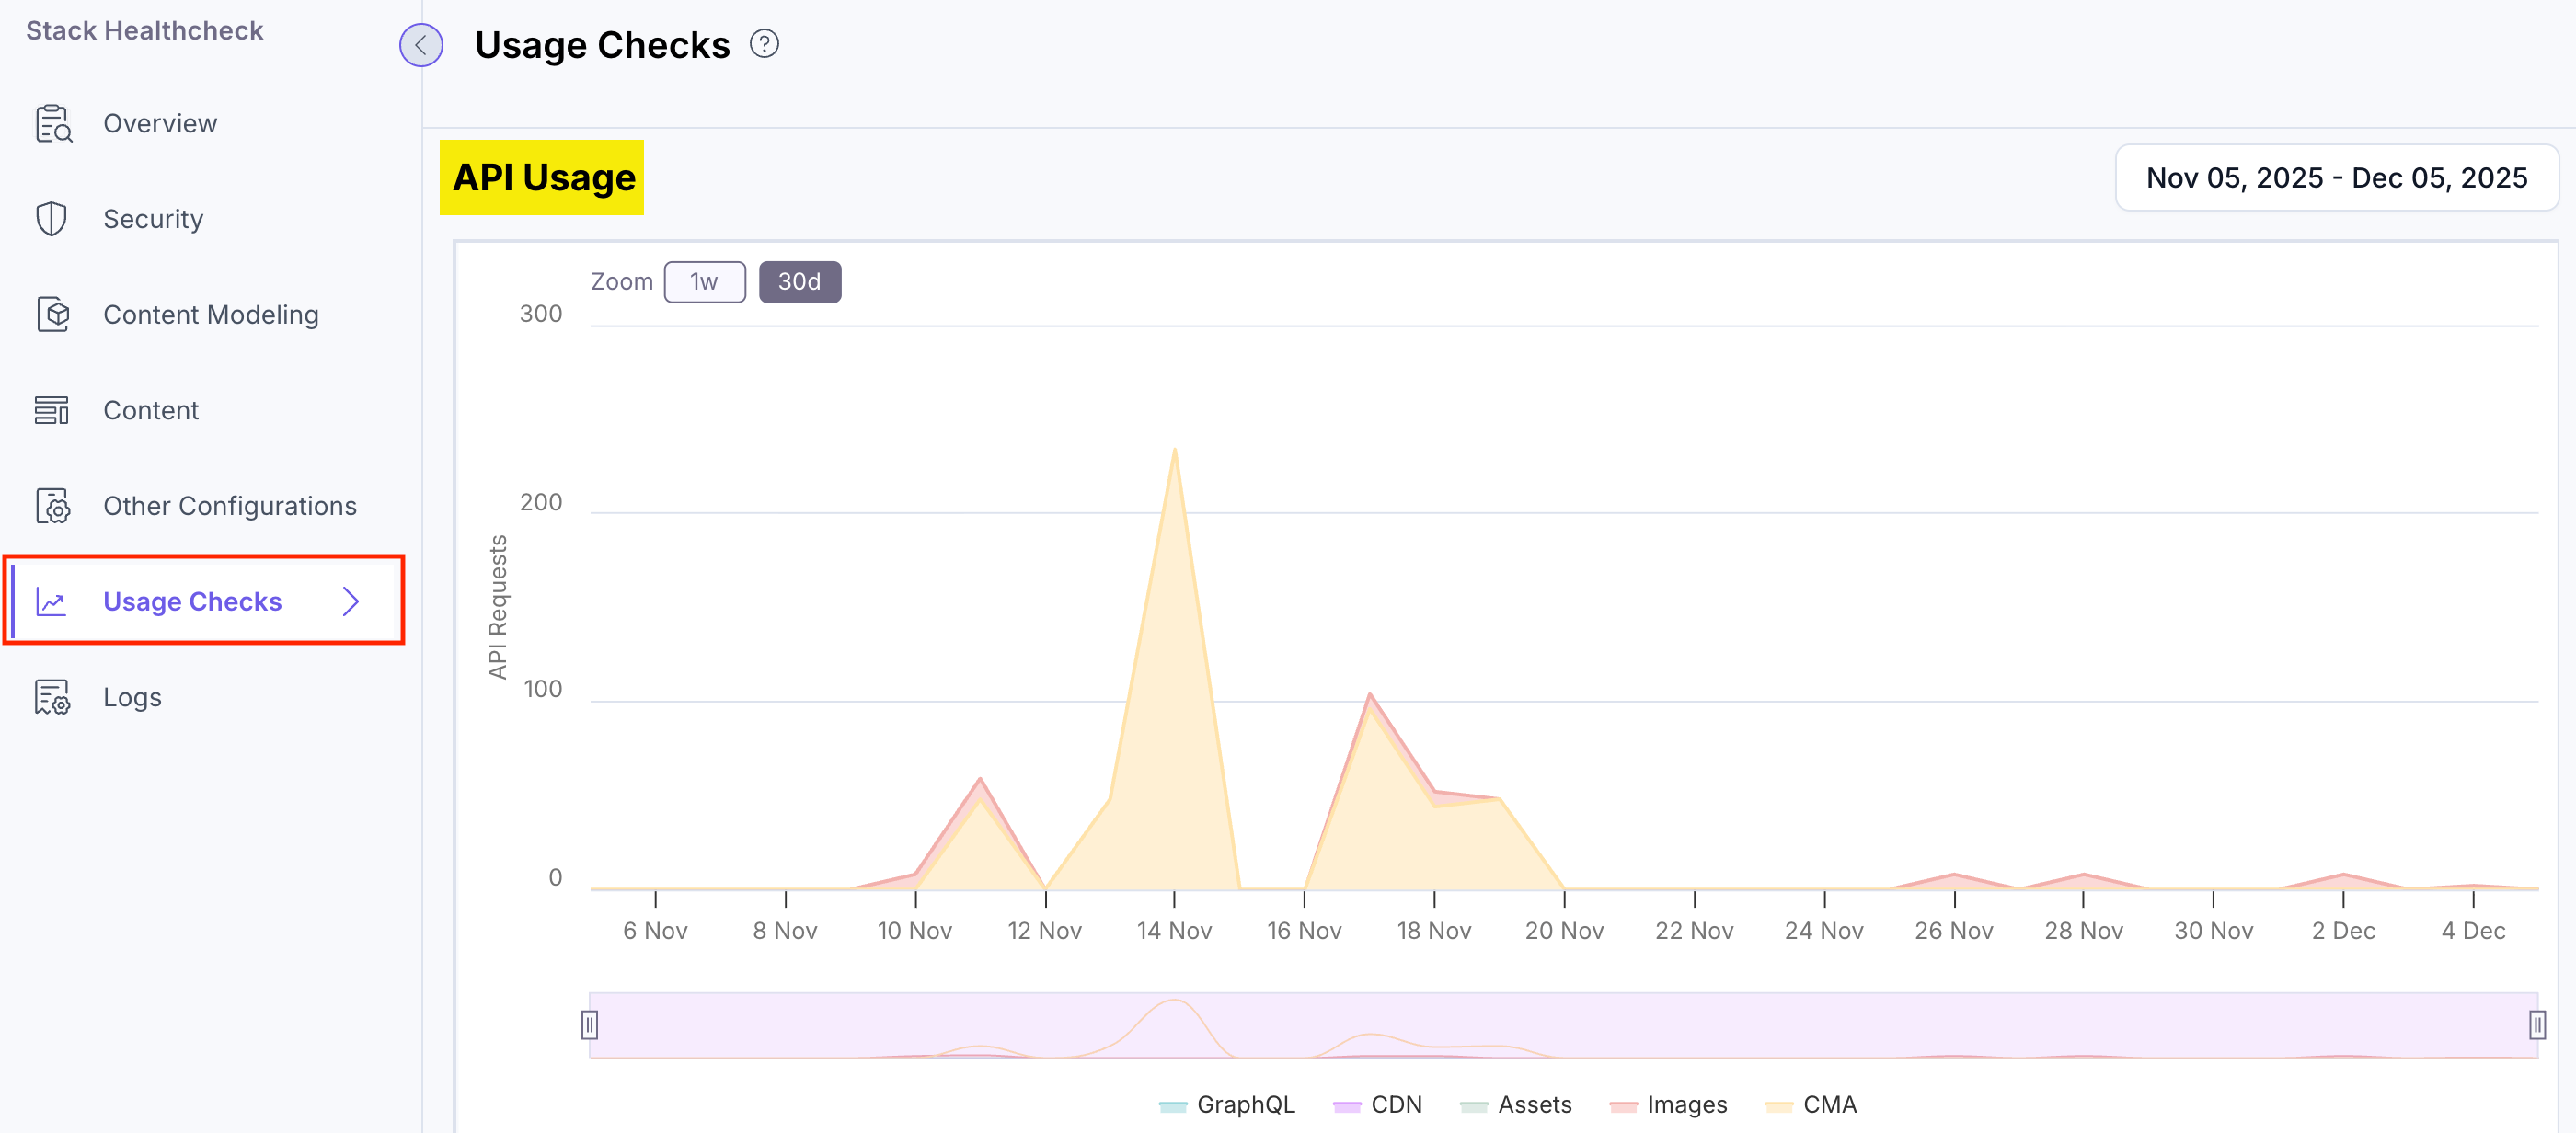
API Usage:
Logs
Under the Logs tab, the Healthcheck app records events and system activities related to the health and performance of your stack. These logs can help users and administrators identify and troubleshoot issues within the Contentstack environment.
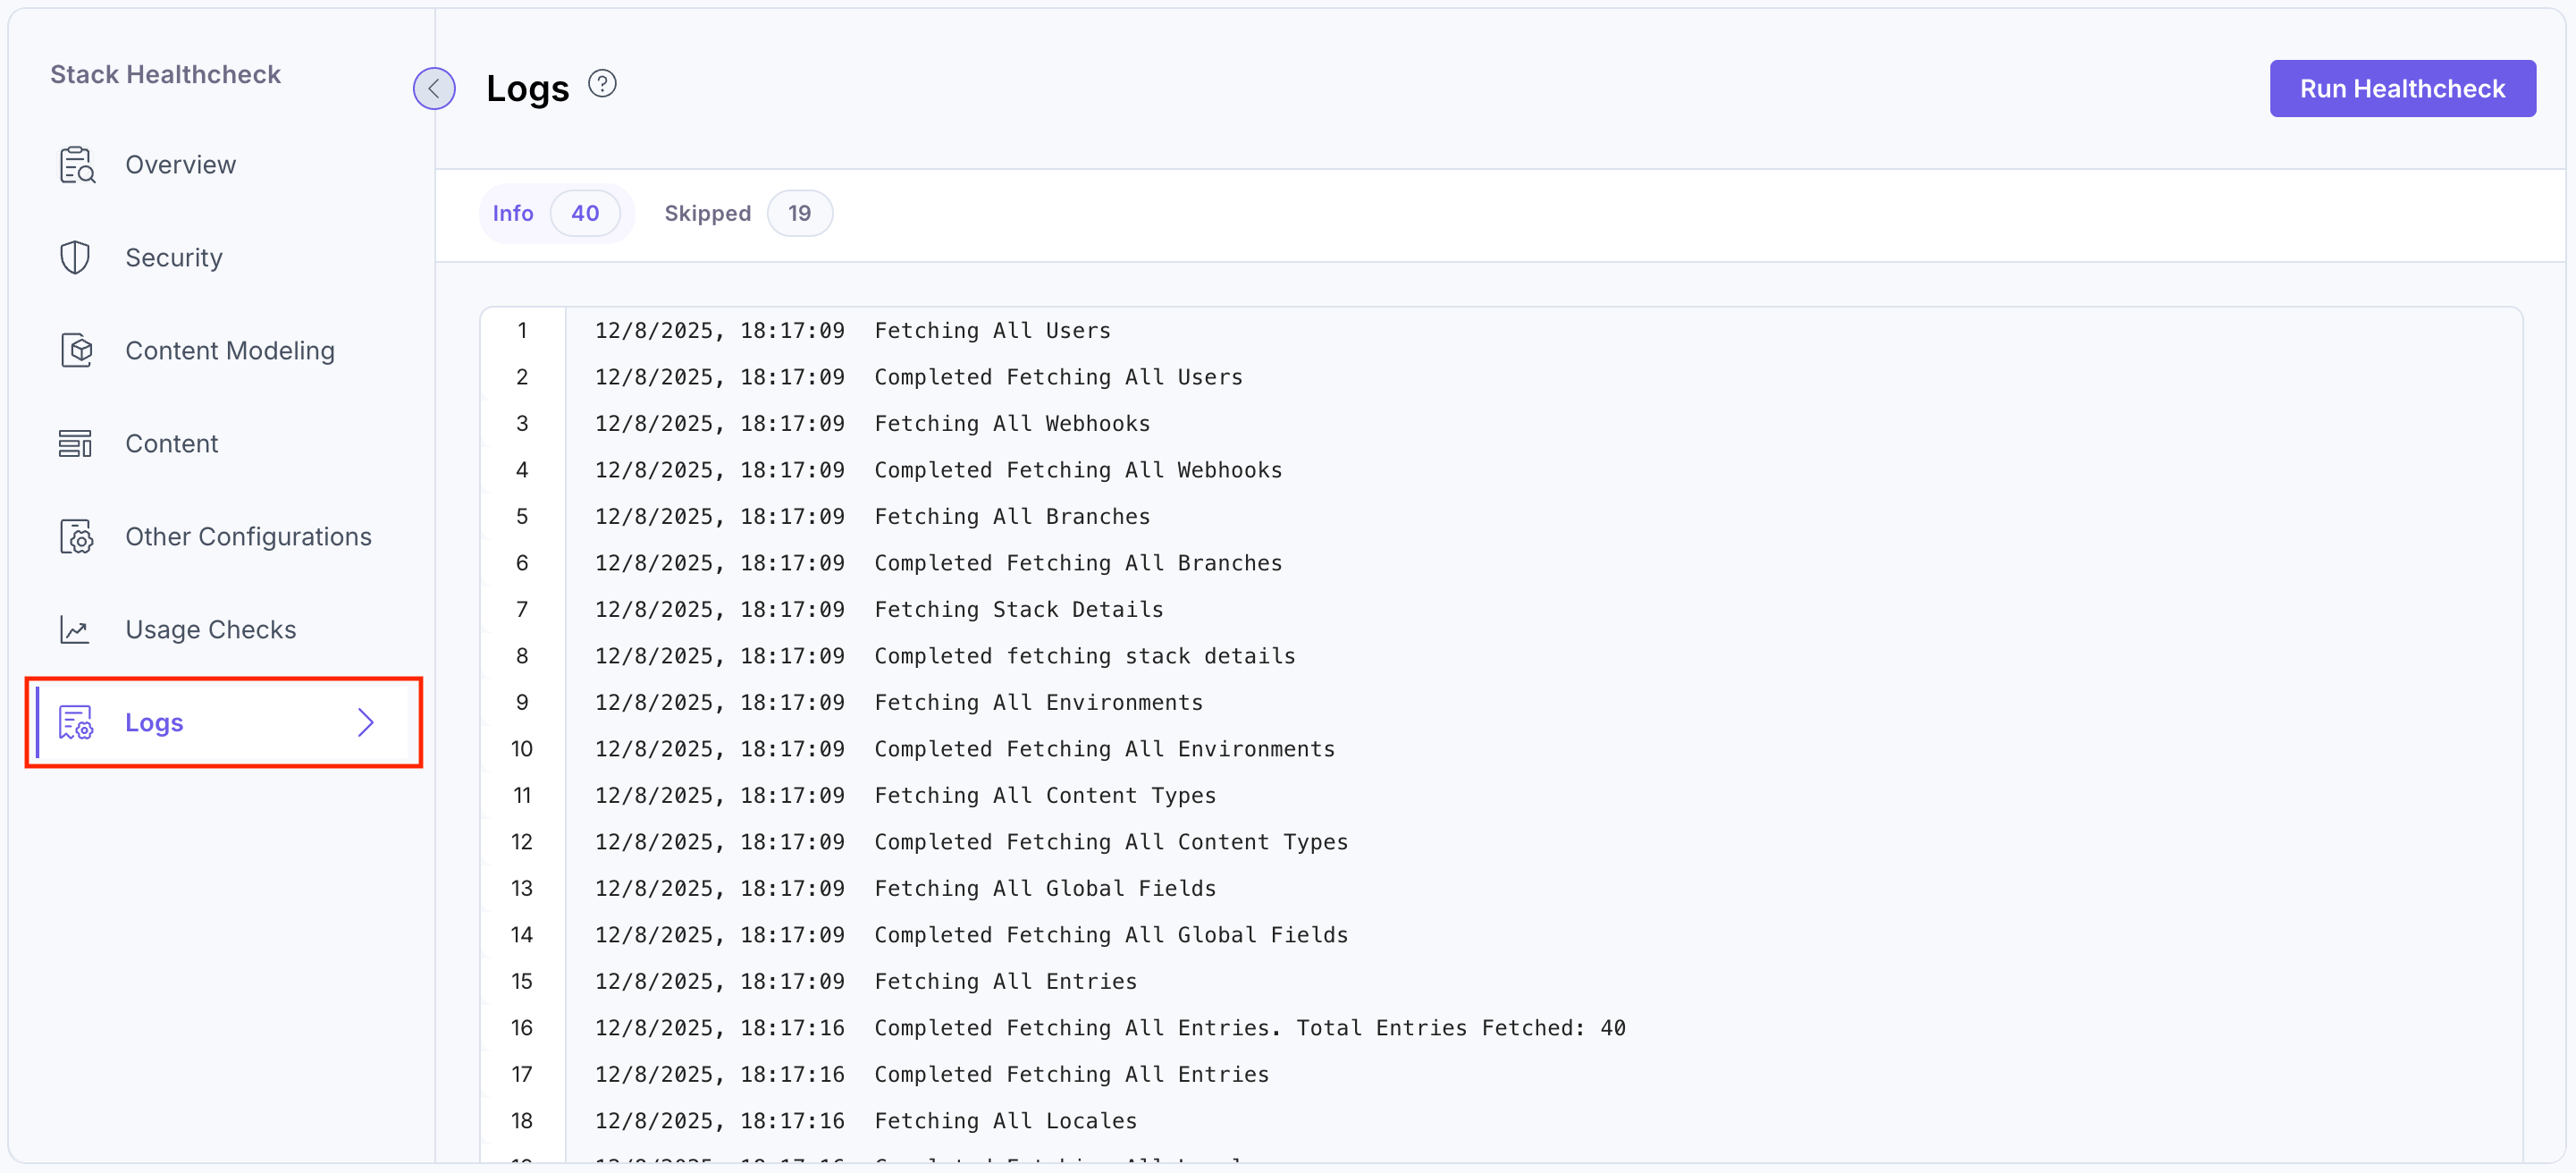
The Info tab displays all logs (along with the number of logs), whereas the Skipped tab shows the skipped logs.
- Navigate to the stack dashboard, click Apps from the header, and select the Healthcheck app.
Note:
- The actual count depends on the number and complexity of content types and the number of entries associated with them. For further details, please contact tso-healthcheck@contentstack.com.
- It is recommended to perform the health check during off-peak hours to minimize potential rate-limit issues. The process utilizes your Content Management API (CMA) bandwidth, so scheduling it during quieter times ensures seamless and uninterrupted operations.
More articles in "Analytics"
